From time to time this year (as time permits), I’ll delve in to MLB.com’s pitch f/x data to analyze a starters outing. Tonight we look at Jeremy Bonderman’s start against the Kansas City Royals on April 3rd.
Pitch Mix
This season MLB.com started classifying pitches. This seems pretty convenient, but from what I’ve seen so far the classifications don’t quite match. In the case of Jeremy Bonderman we know he throws both a 2 seam (sinker) and 4 seam fastball, a slider, and an occasional change. The data had Bonderman throwing a splitter, which looks to be a misclassification of his slider. Because of this, I did my own pitch classifications using K-means clustering and some judgment.
The table below shows his pitch mix and average velocity for the 87 pitches tracked by the system today.
	    n     mph
2seam       39   92.0
4seam       25   92.6
change       4   83.8
slider      19   85.6
It’s not uncommon for Bonderman to rely heavily on his slider, to the tune of a third or more of his pitches typically. Today it was a mere 21%. And while categorizing the various fastballs can be hit and miss, Bondo’s slider is pretty distinctive so I have to believe it isn’t a classification issue.
The plot below shows the horizontal and vertical movement. Technically it’s the difference between the actual pitch and a similarly thrown pitch without spin. Pitches can’t technically rise, so the positive vertical movement is an indication of a resistance to sinking. Don’t worry too much about the physics, but the graph is simply to show that the clustering of the pitches by movement is fairly accurate – especially with regard to the slider.
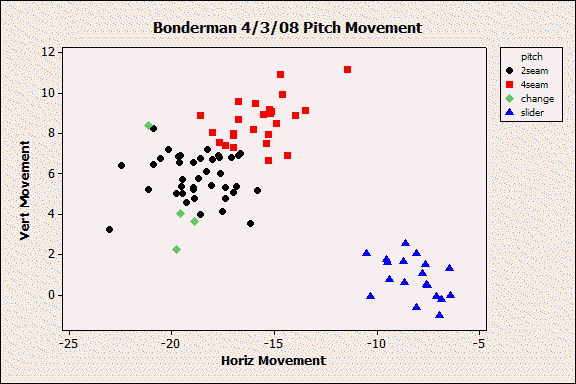
While there has been much talk of more change up use, it appeared to be pretty limited today and consistent with his use of it in the past.
First Inning
Yes, yes, Bonderman struggles in the first inning. But not today. One of the theories is that he throws too many fastballs. He didn’t deviate today but had pretty good results. His pitch sequence in the first was:
2seam-4seam-2seam-4seam-slider-2seam-slider-2seam
But it worked because he was throwing it for strikes.
Location and Results
We can also see how Bonderman pitched to both right handers and left handers. From the graph below he was pretty effective staying away from left handers and staying down in the zone against right handers. Also, when pitching to righties he picked up a number of outs on pitches on the inner half of the plate. Bonderman’s pitches tail in towards right handers meaning hitters were having to fight off those inside pitches.
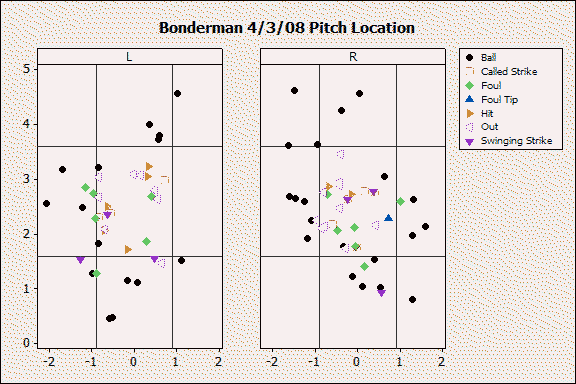
The other thing to note here is look at how selective the Royals were. There were very few swings at pitches outside of the strike zone – or at least far outside the strike zone. I wonder if there was a causal relationship between the chasing of pitches and the relatively low number of sliders.
Wearing down
Jeremy Bonderman was cruising early in the game, but in looking at the data it becomes clear that he ran out of steam. That shouldn’t be at all surprising given how early it is in the year. The plot below is the speed of his 2 seam fastball as the game progressed.
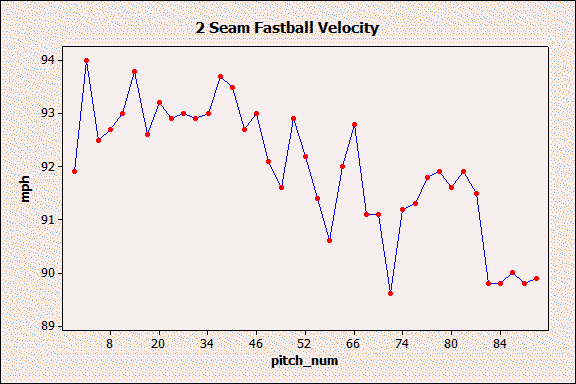
In fact, his last 5 pitches were pretty much identical. They were all 89 mph fastballs with very similar movement, and they showed an increasing tailing action. The same action that we saw when Bonderman was fighting his elbow late in the year. I’m not suggesting he’s hurting, just that he was fighting to find anything that last inning.
Scouting
Now for those of you who saw the game, does the data mesh with reality? I was at work today and was only able to listen. Does the data make sense to those of you who saw the game?
Comments
8 responses to “Pitch f/x: Bonderman 4-3-08”
Seems pretty spot on with me from what I saw — but I found myself far more captivated with Johnny Cueto, the 22 year old RHP for the Reds — dominating the D-Backs to the tune of 10 Ks/0 bb’s and 1 hit (A HR to 20 year old Justin Upton) being his lone blemish in 7 innings. But that’s because I like prospects and get excited when they do well.
All the graphs were easy to read (to me at least … I think I spotted the change up that Gordon smoked out … get used to him Mashing too, he’s so good. Well, will be).
I’ve never seen the big deal with Bonderman being bad in 1st innings. I’d rather he give up 2-3 runs in the first, be lights out for 6 more, and win the game 4-3 (obviously didn’t happen today, but he was equally as bad last year in the first innings of each of his first 18 starts where he was 10-1, with a mid 3’s ERA and crazy 4+:1 K:BB ratio or, in short, one of the 5 best pitchers in baseball in that stretch).
Well done, Bill.
Hey, I was curious where I could find this sort of info, I’d love to be able to include it in my own site. Did you plot the charts yourself or are they available somewhere – if you did them yourself, could you provide me with an explanation of how?
Yep, I saw most of it and it did look like his ball didn’t have as much zip and was relying more on the fastball and changeup, and not the sider
Gordon hit a change-up out I believe
Like JV and KR he did seem to run out of gas so to speak and that is when they started to light him up, even so –
Inge hit the HR and that was that
Still Billfer what do you think about Barry Bonds?
I really wouldn’t mind sticking him in Sheffield’s spot, just thinking of how m any RBI opp. Maggs would have would be downright sick (also how many more pitches Poly would see) assuming Shef is really hurt
Corey
The information is all captured on mlb.com’s site, you just need to know where to look. The file for this data is at:
http://gd2.mlb.com/components/game/mlb/year_2008/month_04/day_03/gid_2008_04_03_kcamlb_detmlb_1/pbp/pitchers/425827.xml
The graphs I made using Minitab, but you could do similar with Excel or R. Minitab has a free 30 day trial if you want to check it out.
As for working with the data, Mike Fast has put together a tutorial.
http://fastballs.wordpress.com/2007/08/23/how-to-build-a-pitch-database/
Good stuff. Interesting that all three starters seemed to tire quickly in the 6th/7th innings. Could it be they didn’t build up arm strength enough during spring training? Alternately, is Leyland leaving the starters in too long because he doesn’t trust the bullpen? Or is it just a random 3-game-sample thing?
Off to the game shortly. Hopefully, my adorable family will bring some good luck to the Tigers . . .
Since this post is using the pitch f/x/ system….
I was looking at pitch f/x data for Kenny Roger’s start Wednesday, and it sort of looked like he had two changeups. Does he really? One faster (84-80 compared to 80-76) with more tailing action than the other. Perhaps a straight change and a vulcan change or forkball or splitter?
I probably just insane though.
Rogers throws so many different variations of his pitches (different speeds, different breaks) he is tough to categorize. The system also generates a confidence score for the pitch classification, and many of Rogers appeared to be a pretty low score.
[…] task of trying to hold the Boston Red Sox to negative runs. In his last start he pitched well until running out of gas around the 70 pitch mark. I’d expect that Bonderman will throw heavy doses of 2 seam fastballs trying to get some […]