So we know the Tigers offense has been bad. Since I’ve been writing about the Tigers for 100 games this season, I’ve run out of adjectives for bad, so let’s just stick with bad. Last night however, they managed to score 7 runs. Five out of the seven runs came courtesy of two out hits. This is unusual because the Tigers are hitting .176 with runners in scoring position and two-outs. This got me thinking about the Tigers offensive efficiency. Even when the Tigers get baserunners, they seem to do a poor job of turning them into runs. I looked at a simple measure that I called Throughput (it probably has other names as well, don’t mean to be stepping on anyone’s toes), which is runs divided by hits+walks+hbp’s. Essentially, the number of baserunners that turn into runs. Not surprisingly, the Tigers throughput of .307 is last by a long margin. Cleveland is next worst at .351 and the AL average is .380.
I then came across the Run Efficiency Average on the Diamond Mind Site. REA is runs divided by total bases plus walks. Not surprisingly the Tigers are dead last in the American League by an incredible margin.
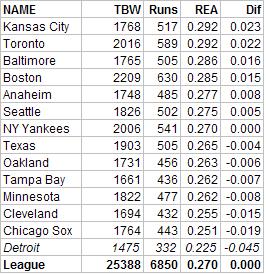
The league average is .270, and the Tigers are at .225. Last year the Tigers were at .238, and the league average was again .270. In Tom Tippett’s article he points out that it is very rare for teams at the extremes to repeat performances from year to year. Of the 20 least efficient teams since 1974, 19 improved in relation to the league the following year. The 2002 Tigers were the 3rd least efficient team with regard to league average of the last 20 years, and have moved even farther from the mean this year.
So in conclusion, the Tigers don’t get many people on base, and they have a hard time converting those baserunners into runs. As much as I’d like to think that the caught stealings and sacrifice bunts have contributed, I’m not sure they have. True, the Tigers lead the league in caught stealing with 45 and sacrifice hits with 43. However, the Royals have 41 sac bunts and are leading the league in efficiency. Also, the caught stealing number is offset by the Tigers low double play rate. The Tigers have hit into 57 double plays, and the next fewest are Texas’ 68.
The big difference is that the Tigers have had 1485 plate appearances with runners on base. The rest of the league is averaging 1727. Furthermore, the Tigers hit .226/.296/.344 in that situation. What it comes down to is that as bad as the Tigers are at getting runners on, they hit just as bad, and a little worse once they get there. And if the runners are in scoring position, it gets even worse when they hit .214/.289/.336. And while it’s hard to imagine, they are even worse when there are two outs and runners in scoring position, .186/.287/.285.
The Tigers just aren’t good by any offensive measure. Next week I’ll look at the Tigers REA against.
Other Stuff
-I’ve been trying to promote some of the other great blogs out there. Seeing as the Tigers just played the Indians, now would be a good time to mention the Cleveland Indians Report. It’s where I go to check in on the Tribe.
-The more games Ben Petrick doesn’t play at catcher, the less I like the trade. At least he had a break out game last night.
-Work is pretty busy right now, so I’ll probably only be doing two updates a week or so for the next month.
Would it be worthwhile amending the throughput formula to discount home runs? Would that give a better indication of how many baserunners are converted into runs by a series of batting events?
(r-hr)/((w+h+hbp)-hr)
I considered doing something along those lines, but then it got a little more complicated. Because if you try to remove the home runs from the equation, do you have to take away the other runs that scored on the homer as well? Also, it seemed to me that a home run is the most efficient way of converting baserunners to runs (There is no out created advancing somebody, and for the hitter, its an efficieny of 1.000). That’s not so say there aren’t other ways, the Royals lead in this statistic, despite being middle of the pack in home runs.
It’s an interesting point nonetheless.