It is quoted after nearly every game, with only the loss column frequently changing. Currently it is 1-25, with IT being the Tigers record in games in which they score 4 runs or less. Some people point to it as a sign of the pitching staff’s futility while others question why the offense is scoring so little so often. Like many of the Tigers struggles this year, it can’t be attributed to just one area.
We’ll start by looking at some broader data. Below is data for the American League showing runs scored per game and the corresponding winning percentage so far in 2008.
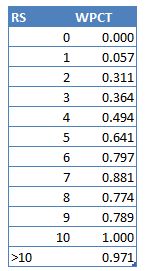
Not surprisingly it’s hard to win your scoring fewer than 2 runs a game, and the odds increase dramatically with the 2nd and the 4th runs. Now let’s look at what the Tigers have done.
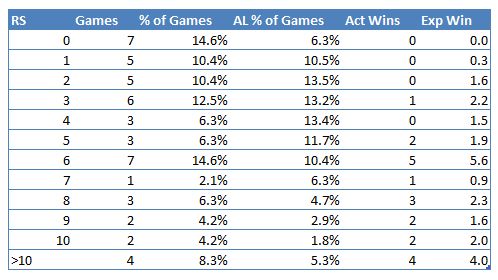
What you’re seeing is how frequently the Tigers scored a certain amount of runs, how frequently it was done in the AL, how many games the Tigers won at each run point, and how many they would be expected to win given AL norms.
The thing with the 1-25 record is that the Tigers have scored fewer than 2 runs 12 times giving them 12 games with virtually no shot to win regardless of the pitching. And in those 4 run games where the team should have nearly a 50-50 shot of pulling out a W, the Tigers have only had 3 such games.
So with some normal pitching, the Tigers should have expected to win at most 3-4 more games. Chalk those up to the staff, but the bulk of the others fall squarely on the shoulders of the offense.
Nice work, Bill.
Yes, nice work. Another way to look at it:
TOTAL RUNS SCORED IN GAME (TIGERS W-L)
2 (0-1)
4 (0-2)
5 (1-6)
6 (1-1)
7 (1-4)
8 (1-3)
9 (1-2)
10 (3-0)
11 (3-1)
12 (3-3)
13 (1-3)
15 (1-1)
18 (0-1)
19 (1-0)
20 (2-0)
22 (1-0)
25 (1-0)
TOTAL RUNS SCORED IN GAME (RED SOX W-L)
1 (1-0)
3 (3-4)
5 (3-1)
6 (1-1)
7 (3-0)
8 (3-0)
9 (2-5)
10 (3-2)
11 (3-2)
12 (1-2)
13 (3-1)
14 (1-0)
16 (1-0)
17 (0-1)
18 (2-0)
19 (1-1)
24 (0-1)
BOSTON 10 runs & under 19-13 (.594)
DETROIT 10 runs & under 8-19 (.296)
BOSTON 11 runs & over 12-8 (.600)
DETROIT 11 runs & over 13-9 (.591)
In 32 Red Sox games where 10 total runs or less scored, their pitching gave up an average of 3.00 runs per game, and allowed 6 or more 5 times. The Red Sox scored an average of 3.63 runs during these games.
In 27 Tigers games where 10 total runs or less scored, their pitching gave up an average of 3.90 runs per game, but allowed 6 or more only three times. The Tigers scored an average of 2.81 runs during these games.
Hazarding a guess, with consistent hitting and all else the same, the Tigers are at least 27-22 right now. Holes in the lineup such as Sheffield and J. jones have been costly. The only bad luck part was the early absence of Granderson.
“So with some normal pitching, the Tigers should have expected to win at most 3-4 more games. Chalk those up to the staff, but the bulk of the others fall squarely on the shoulders of the offense.”
The tone suggests that 3-4 more games is trivial. No….3-4 wins is huge. 3-4 wins is the number of wins that a superstar player provides (compared to an average, replacement-level player) over an entire season. But here we are, little more than 25% of the way through 2008, and you’re proven that the starting pitching has already cost us 3-4 wins.
The starting pitching has cost them “only” 3-4 wins? Well, according to your own data, if the Tigers had merely a mediocre starting pitching staff then right now they’d be 25-24, in first-place. (And this doesn’t even account for the fact that some of those wins would have come against their AL Central opposition.)
This pitching staff is horrible. There’s no sugarcoating it. Their K-rate sucks, their BB-rate sucks, their ERA sucks….so why the hell are we debating what’s already been proven?
Sorry to have wasted your time David.
You put in the term “only.” The 1-25 record is ridiculous and I gave the pitcher there share of blame. But when you score 0-1 runs in a quarter of your games you give the team practically no chance of winning. The blame is shared.
Adding a (key) word that didn’t exist in the original post: One of the reasons it’s very difficult to have an argument with David.
I can’t believe no team has won a game in which they scored zero runs.
And it only gets stranger, Jeremy. No team has ever lost a game where they gave up zero runs, either. The Tigers seem to do worse in games where they don’t score any runs, and I suspect a connection.
Yes, David, the pitching staff has not been “great,” but we didn’t expect them to be. This team was supposed to be carried by the offense and the staff would improve in the second half with a healthy Zoom and Rodney.
The offense, on the other hand, was supposed to challenge for 1000 runs and has been nothing short of horribly disappointing. To have been shutout 7(!!) times and scored 2 or less 12 times, 4 or less 26 times is a bust.
There are plenty of little things to worry about, as always, but the blame for this team’s poor start begins and ends with the offense.
Great post, Bilfer.