Tag Archives: pitch f/x

Pitch f/x is encouraged by Bonderman

Jeremy Bonderman has had a very long road back from the surgery he underwent to correct thoracic compression outlet syndrome. There was hope he’d be back in the rotation this year, but his spring became very extended and he didn’t make his first appearance until June 8th – and he was crushed. It was back to the minors and more rest and rehab, but with the rosters expanded Bonderman is back as a reliever, and the pitch f/x data is promising…so far.

When Bonderman made his June start, his pitches didn’t behave in the way they had in the past. His velocity was down. His fastball didn’t have the same arm side run. His slider wasn’t as tight and was more of a sweeping pitch. The particulars (via Brooks Baseball) were:

Pitch Count Speed Horiz Move Vert Move
FF 48 89.59 -6.66 8.71
FT 5 89.16 -8.16 6.25
SL 22 82.44 1.32 3.25
CH 10 83.69 -7.13 8.32


Let’s fast forward to his latest 2 outings. The results have certainly been better, but what about the stuff?

Pitch Count Speed Horiz Move Vert Move
FF 23 91.60 -9.00 8.55
FT 3 91.03 -10.02 6.31
SL 10 84.13 -0.87 1.57


We see that his velocity is up about 2mph across the board. The fastball has a couple more inches of arm side run and the slider has an inch and a half more drop. This all seems to be good and much more in line with Bonderman’s past pitch f/x numbers.

I’m going to skip the 2008 numbers where he was clearly hurting and couldn’t maintain his velocity. This clouded pitch classification data greatly. Instead I’ll put the numbers from 2007 up. These were harvested from Fangraphs.

Pitch Count Speed Horiz Move Vert Move
FF   92.1 -8.6 7.7
FT   88 -10.7 9.8
SL   84.1 0.5 1.6
CH   84.2 -8 8.3


The pitches from September (granted there are only 36 of them) look much more like the pitches from 2007 than the pitches from the June start. And yes, small sample sirens should be going off. And this is far from an ideal analysis. I’m certain there are pitch classification issues that are especially prevalent between the two seam (FT) and four seam (FF) fastballs. Plus the system was relatively new in 2007 and still being calibrated. Still, the results from this cursory analysis are encouraging.
Faster than fast – the quickest pitches of 2009

On Tuesday night Joel Zumaya threw a ball that the Comerica Park gun, and the Fox Sports gun clocked at 104mph. That is freakishly fast and a little hard to believe, at the very least there was probably some rounding up. A check of MLB.com’s pitch f/x data had the pitch 50 feet from home plate at 102.2mph. So the stadium gun was likely a little hot, but that is still obscene. It did make me curious about the fastest pitches thrown this season.

By my check the pitch f/x system has recorded 91 pitches that topped 100mph this season (through 6/25/09). Of those 91 pitches, they basically all belong to Zumaya.

Pitches 100mph+
Pitcher Pitches
Zumaya 84
Verlander 2
Jimenez 1
Parnell 1
Broxton 1
Lindstrom 1
Lowe 1
Total 91


If you order the pitches in descending order, Zumaya actually has the 38 fastest pitches this season (Justin Verlander had the 39th) and 57 of the 58 fastest. Zumaya has 28 pitches at 101mph or faster.

As for the fastest pitch this season? It wasn’t the pitch that finished Bradley which came in a 102.2. But it did come earlier in the at-bat when Zumaya hit 102.7. For good measure he came back the next day and hit 102.6 against Mike Fontenot. Those are the 3 pitches this season top the 102mph barrier.

Dontrelle’s Debut

Pretty much everyone has beat me to this, but I still feel I should offer up something about Dontrelle Willis’s first start of the year. There are a couple ways to approach the assessment.

You can look at a final line that included 10 hits and 2 walks in just under 5 innings and come away unimpressed or even discouraged. Especially when you look at the fact he only notched one swing and a miss.

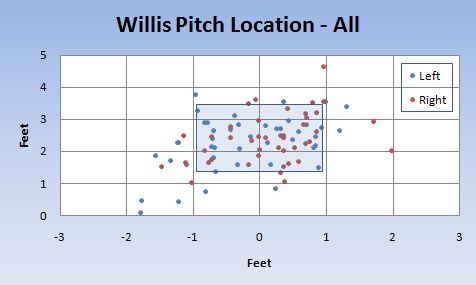
Or you can look at the start in the context of last year when the strike zone proved to be a foreign land to Willis. That he only walked 2 in his time on the mound could be a step forward. And even when he missed the zone, he missed by reasonable amounts, like you’d see in a regular start.

Figure 1 Pitch Location

Dontrelle Willis Pitch Location

I’m encouraged in that I don’t see him pitching scared. He came inside to both lefties and righties. I don’t know if that is by design or a lack of control in the strike zone, but the absence of unintentional pitch-outs is encouraging.

Continue reading Dontrelle’s Debut

Justin Verlander’s New Slider

Justin Verlander has turned in 3 remarkable outings in a row amassing 31 strike outs as hitters can’t catch up with his heater or their knees buckle with the curve. But very quietly Verlander has added a slider to his repertoire.

This pitch received significant attention from Rod Allen and Mario Impemba last night when he picked up a swinging strike with it against Kelly Shoppach. But he actually began throwing it as early as the April 27th Yankees game. The pitch was first noticed by Eric Cioe (who comments here on occasion) and he posted about it at Motown Sports.

Continue reading Justin Verlander’s New Slider

What’s up with Verlander in the stretch?

Justin Verlander has gotten off to a rough start in 2009. People are starting to question his “ace-hood” and with an ERA of 9.00 after 4 starts it is probably justified. What makes his start so perplexing is that his “stuff” appears to be back. His fastball velocity is over 95mph and he’s fanning 10.7 batters per 9 innings. The numbers that really need a deeper examination though are those when runners are on base. Verlander is stranding only 39.6% of runners (a normal rate is 65-75%) and hitters post a 457 OBP with men on and only 296 with the bases empty. What’s up with that?

Continue reading What’s up with Verlander in the stretch?

Game 2009.007: Rangers at Tigers

PREGAME: The Tigers look for a series sweep of the Texas Rangers this Easter Sunday. The Rangers mashed Cleveland pitching but haven’t been able to muster much offense against the Tigers starters. Today it will be Edwin Jackson making his second start of the season. His first effort was wasted by the bullpen as he pounded the strike zone (67.4% strikes) en route to a 7.1 inning, 89 pitch start.

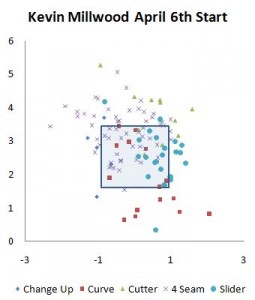
Kevin Millwood April 6th Start - pitch fxKevin Millwood pitches for the Rangers. He held Cleveland to 1 run in 7 innings on 5 hits, a walk, and 5 K’s. He went with a fastball heavy repertoire (91MPH 4 seam, 90MPH 2 seam), and didn’t seem to get the ball down that well. Still, the results were impressive. Hopefully if he keeps the ball up against the Tigers, they’ll either layoff it or hammer it.

Game Time 1:05

Texas vs. Detroit – April 12, 2009 | MLB.com: Gameday

POSTGAME: It’s a good day to be named Brandon. Inge of course due to his 4th homer (and career number 100) to start the 8th inning comeback and his 2 out RBI single to cap it. Plus he threw in a slick play on a bunt to start the 9th. Part of the reason that the Tigers only needed to come down by 4 is because Brandon Lyon came on and retired 6 straight batters on 17 pitches. It was a very nice bounce back outing, and only his second since he blew Edwin Jackson’s last start.

As for Jackson, he wasn’t as sharp as his last outing, but mostly effective. He pitched out of a big jam in the 5th and in the 6th inning he retired the side on 10 pitches, mostly 95mph+ fastballs to put a nice cap on his day.

Kevin Millwood was frustratingly good. It was a steady diet of 89 mph fastballs and curves that had the Tigers completely fooled.

  • Fernando Rodney picked up the save on 5 pitches (and the previously mentioned nice play by Inge)
  • Placido Polanco seems to have his stroke going after a slow spring
  • A couple of awful at-bats by Magglio Ordonez and Gerald Laird in that 8th inning. Fortunately the rest of the team picked them up.
  • Speaking of which, how about the struggling Carlos Guillen lacing a two strike double down the line?

Not pounding the zone

Way back in 2008 I started to run a series using pitch f/x data to look at strike throwing tendencies. Sadly this is the slowest moving “series” of posts ever. Nonetheless, it’s time for part 3 where we look at how teams do when they get strikes outside of the zone. For this exercise I’m not looking at those generous calls off the corners, but for those strikes when hitters go fishing.

The first table we turn to is the fish rate, or the percent of pitches outside of the strike zone that hitters swung at. This is presented by count. As for the pretty shading, red are lower numbers and green are higher numbers.

Continue reading Not pounding the zone

Pounding the zone by count

In part 1 of the series I dumped some big tables in here that looked at the rate at which teams threw a)strikes and b)the ball in the strike zone. Today we’ll continue along the same path, but we’ll start to differentiate based on count.

Pitches In the Strike Zone by Count

In 2008 teams pitchers through the ball in the strike zone (as defined by pitch f/x) at the following rates:

  • 0-0: 48.0%
  • 1-1: 45.0%
  • 2-2: 43.0%
  • 0-1: 40.0%
  • 0-2: 27.1%
  • 1-2: 34.6%
  • 1-0: 49.8%
  • 2-0: 51.6%
  • 3-0: 49.9%
  • 2-1: 51.2%
  • 3-1: 55.9%
  • 3-2: 53.8%

Continue reading Pounding the zone by count

Strike Throwing – Part 1 – Lots of Tables

The Tigers walked a lot of people last year. Along the way they threw a lot of pitches, and many seemed to be ill advised. The performance cost Chuck Hernandez his job, jettisoned in favor of an instructor whose students have gone on to gain some renown as strike throwing machines. Armed with a season’s worth of pitch f/x data I’m ready to start delving into this whole strike throwing thing. We’ll start today with some general league wide information.

For those unfamiliar with pitch f/x I’ll have some additional links to more information at the end of this article. The short explanation is a couple of cameras measure the direction and speed a ball is moving shortly in front of the mound. From this the pitch’s path is calculated to within an inch of where it crosses the front of home plate. And it draws the trajectory in the MLB.com Gameday application. On to the data…
Continue reading Strike Throwing – Part 1 – Lots of Tables

Evidence of bizarre strike zone disappears

In last night’s Detroit-Arizona game there were several moments where I was completely befuddled by CB Bucknor’s strike zone. But I was going to just consider my bias as a frustrated fan and let it go. Then I saw Tom Gage’s game story and a ball-strike call was the lead for his story. So I thought I would go back to the pitch f/x data and post a couple of the at-bats in question. Except for one thing. The pitch f/x data that had been there throughout the game had disappeared this morning.

One of the moments in question was in the top of the 7th inning when Jeremy Bonderman appeared to freeze Justin Upton with a called third strike on a 2-2 count. Except it was called a ball and Upton would later go on to walk. I was IM’ing with Ian and couldn’t believe the pitch, but I chalked it up to being the frustrated fan of a floundering team.

The other egregious call was in the top of the 8th inning when Curtis Granderson was called out an a fastball that was borderline low, and at least 6 inches off the plate. The frustration of the one call combined with the crappy play of my team had me furious at this latest call. But I thought I would give it some time before posting. I try not to blog angry.

But when I went to post the at-bats in question this morning, the pitch f/x data is gone. There are still plots of the pitches, but not as tracked by pitch f/x and not where the actual pitches were. The system was working last night. It worked the night before at Chase Ballpark and the data still persists. It worked in other ballparks last night where the data still exists.

Perhaps it is some kind of data glitch where things were broken only at Chase only after that game. And in fairness I checked the other games that Bucknor has done this year, and all the data is there. So maybe I’m just irrational frustrated fan guy right now who is pissed because his team isn’t playing better, but I did want to graphically show how bad the calls were. Plus I have a long running disdain for Bucknor for other reasons.

C.B. Bucknor’s umpiring acumen has been well documented. In a 2003 Sports Illustrated survey of players he was voted worst umpire. In a 2006 Sports Illustrated survey of players he was voted worst umpire. So at least he’s consistent in his sucking.


Verlander arm angle follow-up

Prior to Justin Verlander’s last start we discussed his dip in velocity and a change in arm angle is he was looking to make. Verlander had some improved results in his Tuesday night start against the Rangers. Looking at his pitch f/x data he averaged 93.9mph with his fastball and peaked around 97mph. A definite improvement to be sure.

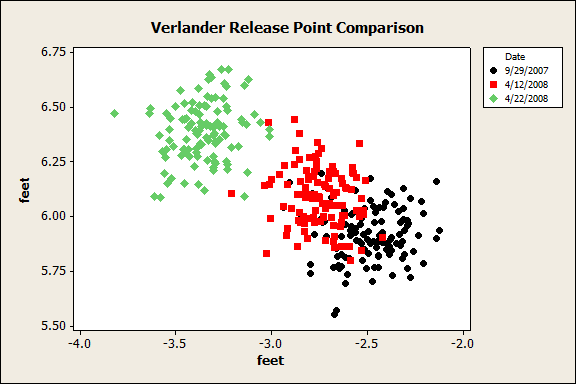
As for the arm angle, I added his Tuesday night release point data to the previous graph. Now there may be some calibration issues because the latest data was from Comerica Park and the other data was from Chicago. But there appears to be a marked difference, and maybe even an over adjustment.

Verlander and his arm angle

As has been widely documented at this point, Justin Verlander’s velocity is down significantly. Either it is a systematic change in measurement mechanisms, or it is a real dip. Given the remarkable disparity and the fact it doesn’t seem to be effecting other pitchers the same way, I’m inclined to believe it is real. The question is whether it is by design (slower pitches, more movement, more longevity is one theory), it is mechanical, or it is related to injury.

Verlander recently did a side session in which he was working on his arm slot saying that he had been throwing with a lower arm angle and was working on raising it. While we can’t necessarily look at his arm angle with pitch f/x data we can look at an approximation of his release point.
Continue reading Verlander and his arm angle