- Juan Samuel finds a job: Juan Samuel will be the manager of the AA Binghamton Mets. The former Tiger 3B/outfield coach is the second member of last year’s staff to find work in the minors. Bruce Fields will be the hitting coach in Buffalo.
UPDATE: It appears that Lance Parrish will also be in uniform next year. He’ll be in the Dodgers organization managing Rookie level Ogden.
- Caravan Connection: Roar of the Tigers hooked up with the Tigers caravan in Saginaw and scored some interviews. First up is Placido Polanco.
- Omar’s leather: Baseball Musings continues to churn out PMR data. The first batch of position tables is out, and Omar Infante tops the list. In roughly a quarter of a season at short, Infante made 14 plays more than expected.
However, if you look at just ground balls Infante isn’t quite as impressive. He is only 6 plays better than expected on ground balls, meaning that he fields more than his share of pop-ups or he was good at standing where line drives were hit. However, he is still second on the list. Second only to former Blue Jay, former Tiger, current Blue Jay John Macdonald.
It should also be noted that even though Omar was second in difference of actual and expected, his actual DER was the highest among all shortstops for groundballs.
- Monroe negotiations continue: The Tigers and Craig Monroe continue to negotiate a new contract. Monroe is the last of the Tigers arbitration eligible players not to sign. At least he seems to be in good spirits about it
“I don’t know what’s going to happen,” Monroe said. “I know my agent (Adam Katz ) has been talking with John Westhoff (the Tigers’ vice president/legal counsel). They’ve had a lot of conversations. Things seem to be going well, but I haven’t really thought much about my contract or talked to my agent much about it.
“That’s why we hire agents. Let them take care of their part, I’ll take care of getting ready to play.”
- Happy Birthday: I’m a few days late in posting this, but Ryan Sosin and the crew at Tigers Central celebrated their 5th birthday/anniversay/whatever this past weekend. Congratulations guys and keep up the good work.
Category Archives: Statistics
Luck and Fieldability
David Pinto from Baseball Musings has begun to release the 2005 Probabilistic Model of Range (PMR) data. Today he posted a table of which pitchers had more outs than expected on balls in play (or the lucky/unlucky) as well as rankings of the expected percentage of outs on balls in play (how easy was it to field behind a pitcher).
Continue reading Luck and Fieldability
The Platoon Ratio
When talking about players strengths and weaknesses, ultimately the discussion will veer towards: “What they really need is a platoon because player X can’t hit Y-handers to save his life.” Okay, so maybe not every baseball discussion goes this way, but I’m sure you’ve all heard it, and perhaps even said it before. That’s why it may come as a shock, but the differences in platoon splits amongst right handed hitters are basically non-existent.
Let’s take a look at that statement again. I’m not claiming that right handed hitters don’t hit lefties better than righties. In fact, right-handed hitters hit lefties 9% better than righties. What’s surprsing is that all – or virutally all – right handed hitters share the same platoon advantage. So all right handed hitters OPS against right handers will be 9% better against southpaws than against right-handers (northpaws?).
Without a lot of indepth explantion, this is a concept that has been revealed by Bill James, and covered by Rob Neyer. Here is probably the best one paragraph explanation I could find:
In fact, if every player played enough games — thousands and thousands of games, I mean — eventually all of them would have roughly the same platoon split. There is some evidence that some types of hitters will have slightly larger platoon splits than others, but essentially they’re all the same. I know, it sounds crazy. But everyone who’s looked at this with any degree of sophistication has come up with the same answer. As James wrote in 1988, “It’s innate. You can’t get away from it.”
Good and Bad Gloves
David Gassko of the Hardball Times introduced a new defensive measure of range earlier this season. While the initial article didn’t do a lot to sell me on the system, he has calculated the 2005 rankings.
Ivan Rodriguez, Nook Logan, and Brandon Inge were the top defenders in the American League at their positions (Inge was actually tops among all third sackers). The fact that Logan beat out all AL centerfielders was surprising. Not that I don’t think Logan isn’t good, but just from a playing time aspect. Because the measure used is a counting stat (essentially runs saved), I didn’t think Logan would have enough time in center to finish at the top.
On the other end of the spectrum, Carlos Pena and Magglio Ordonez finished near the bottom at their positions. Again, I’m a little surprised merely from a playing time perspective.
But the most surprising finding is that Rob Fick was among the best first basemen.
Now whether or not you buy into this system – and I haven’t yet – it is reassuring that a couple of those critical “up-the-middle” positions were rated very highly for the Tigers. But then again, of the 3 Tigers who finished at the top it doesn’t appear clear cut that they will be manning those positions next season.
Tiger Win Shares 2005
Next in my series of recapturing the glory/trauma of the 2005 season I take a look at Win Shares. Other posts so far in the series include DL Time, Runs Created by Position, and Offensive Efficiency.
The image you see below is a treemap. Offense is represented by the light orange boxes, pitching is by the middle tone of orange, and defense is the darkest shade. (For more on treemaps and some earlier examples click here or here)
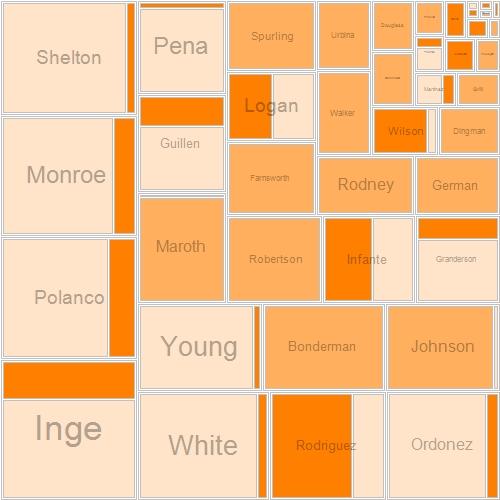
Inge led the team in Win Shares with 16.7. He also had by far the most playing time so the feat isn’t that astounding. Chris Shelton led the way with offensive win shares with 12.8.
Jeremy Bonderman led the staff in pitching win shares with 9.5 while Jason Johnson and Mike Maroth each contributed 8.5 It’s worth noting that during his time with the Tigers Kyle Farnsworth accumulated 5.9 win shares.
Pudge’s biggest contribution came via defense where he led the team with 8 win shares (although from what I’ve seen defensive win shares favor catchers).
As a team, 50% of the Tigers win shares came from the offense, while a third came from pitching and the remainder were defensive.
If you’re interested in perusing more win shares data, or for an explanation of win shares, check out the Hardball Times. And if you’re really interested in learning about win shares, it is probably best to go right to the source and get the Bill James book – Win Shares which describes the measure and methodology. (FYI – That’s an Amazon affiliate link which puts a few coins in my pocket if you choose to purchase the book)
A Model of Inefficiency
It was a familiar scene for Tiger fans this season. A runner gets to third base with less than two outs. The next batter would invariably seem to do one of three things, a strikeout, a sharp ground ball to third, or a pop out to second. Once that second out was secured, the final out would be a fairly deep fly ball that would have been quite useful one out before. The Tigers seemed to have an uncanny ability to ruin great scoring opportunities in 2005. But was this really the case, or did it just seem that way?
The first thing I did was to take a look at the teams performance with RISP. The Tigers batting average with RISP was a very respectable .273 which was good enough for 6th in the American League. The problem was despite a decent average, the OBP in the same situation was a dismal .335 which was next to worst. Now I won’t go all sabremetric and say that a walk is as good as a hit in these situations. Clearly, a hit is more likely to score a runner than a walk is. However, I think everyone would agree that not making an out, and having an additional runner get on only increases your scoring potential. The other problem is that the nature of outs the Tigers were making wasn’t conducive to run scoring. The Tigers had the 4th most strikeouts with RISP, despite ranking 11th in plate apperances in that same situation.
So was the Tigers biggest problem getting runners on to drive in, or were they especially inefficient at it as well? Below is a table showing TBW (Total Bases + Walks) and REA (Run Efficiency Average). TBW is essentially a summation of a team’s offensive events. REA is simply runs divided by TBW – which gives an indication of how effectively teams cashed in on their offensive events. For more information on TBW and REA, please check out this article by Tom Tippett.

While the Tigers are middle of the pack in TBW, they are near the bottom in terms of efficiency. Next I wondered what the impact of home runs would be on this measure. Afterall, the Tigers play in a park that discourages homers especially for right handed hitters (of which the lineup was heavily tilted towards). Plus, while a run scoring from a home run still counts (as do the runs on base) I was more interested in seeing the teams ability to get the runners they have home.
I modified REA (I call it REA-2) to take out the home runs. By “take out” I removed the homers from the TBW total (or 4 TBWs for every homer) and I subtracted the home runs from the run total as well.
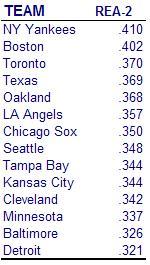
According to REA-2, Detroit is the least capable of getting their baserunners home. Now I don’t know if this means anything, because I just made up REA-2, but it seems to make some sense (feel free to poke holes in it). It serves to further highlight that the Tigers were very inefficient.
So why were they so inefficient? My guess is that it was a combination of their poor on base percentage (or the ability to make outs) short circuiting rallies, a lack of team speed, an abnormally high strike out rate given the team’s other offensive characteristics, and possibly some bad luck. This team managed to combine several attributes that when isloated aren’t necessarily a bad thing. Unfortunately they weren’t isolated. They were a slow team that didn’t hit for a ton of power. They relied on the home run in a park that discourages it. They don’t take walks, and they don’t make contact. The result is an offense that was capable of great things some of the time, but struggled more than their share.
Keying in on the Keystone
David Pinto at Baseball Musings is continuing to publish the results of his Probabilistic Model of Range. He has churned out the positional data for shortstops and second basemen. Carlos Guillen looks decent, and Omar Infante doesn’t look too bad.
Guillen       Infante

3597          2710

Act. Outs         490           305

Pred. Outs     496.37        319.00

Act. DER         .136          .113

Pred. DER        .138          .118
Among their peers, Guillen was in the top third (and substantially ahead of Edgar Renteria, the guy the Tigers were looking to sign and displace Guillen) while Infante was right about in the middle. The table was compiled only of players that had 1000 BIP.
Interestingly in Guillen’s case, he had the highest actual DER of all shortstops. Also, his predicted DER of .138 was among the highest so for some reason the balls hit to/near him were more fieldable than most other players. I’m hesitant to make the leap that the Tigers pitchers manage to induce a high amount of weakly hit balls (at least to shortstop), but I don’t have any other explanations either.
While Infante’s numbers don’t really do much for me, it was only his first season with significant playing time at second. He’s also young and probably still has room to grow where it comes to positioning and familiarity with opposing hitters.
Over the course of a full season I’m assuming 4400 BIP for short and 4000 BIP) the two combine to be 28 outs below their predicted range.
Over the course of a full season (assuming 4400 BIP as a full season) the two combine to be 31 outs below their predicted range
I’m curious to see what Pinto’s numbers will show for the Tigers’ 3rd base situation, but I’m not sure that Brandon Inge will have the 1000 BIP to qualify.
For more background on the PMR, check out David’s other posts here and here.
UPDATE: Pinto just posted the centerfield ratings and he has further validated his system: Alex Sanchez rannks near the bottom.
Other Stuff
-I did some updating over on the sidebar. Added are some new Detroit sports links, and I cleaned up some defunct sites. I also removed the section for the 2004 preview and anchored a couple of interesting/highlight type items. So far that includes my interview with Dombrowski and a table that has Tigers’ salaries for 2005 (so far).
-Ordonez watch: Apparently the Cubs are interested and Ordonez will work out for them in California. Will he actually work out or is Boras trying to force the Tigers hand? Or is Magglio just trying to get somebody else to offer up multiple years like the Tigers have done. Did Boras hold off on these workouts all along so that he could get maximum value for his other slugging outfielders (Drew and Beltran) by effectively shrinking the talent pool knowing that he could always get a desperate team to cough up big bucks and years on the eve of spring training? It’s stuff like this that hurts my head but it is par for the course with Scott Boras. The level of suspicion that surrounds any Boras negotiation is almost comical, but well earned.
Odds are…Tigers defense is poor
I wasn’t planning on writing about the Tigers’ poor defense, but then David Pinto published his Probabalistic Model of Range for 2004. I love fresh stats, and this will dovetail nicely with the defense independent discussion from last week.
Pinto’s stats are compiled by looking at play by play data and measuring how likely it is that given ball will be turned into an out. He looks at the direction the ball was hit, the type of hit (grounder, flyball, linedrive, bunt), how hard it was hit, the park, and the handedness of the hitter and pitcher. Pinto’s method is very similar to Mitchel Lichtman’s Ultimate Zone Rating which I used extensively in my defensive preview last year. Lichtman went an additional step and expressed a player’s defensive contribution in terms of runs. Unfortunately for us (fortunately for Lichtman) he’s working for the Cardinals now and won’t be publishing his results.
The Probalistic Model shows the following totals for the Tigers
Balls-in-play: 4524
Acutal Outs: 3091
Defensive Efficiency: .683
Predicted Outs: 3169.2
Predicted DER: .701
The gap between the Tigers actual DER and predicted DER was the 4th worst in the majors. The result is that the Tigers missed out on converting 78 balls-in-play into outs. The pitchers are the real losers in this because innings get extended, run likelihood increases, and so does workload. And it’s not just a matter of pitchers having to face an additional 78 hitters. Considering that 64.9% of the batters against reached base (this includes the non balls in play as well), that means that Tigers pitchers faced an additional 120 batters over the course of the season.
Now hopefully I didn’t just mess up all those calculations and I don’t look like an idiot. Regardless, this just helps to support the commonly held belief that the Tigers defense is below average. The mainstream media typically point to errors and fielding percentage which are horrible measures of defense, but the Tigers were so far behind the rest of the league in those stats they still illustrate the point. It also meshes nicely with Jaffe’s dERA calculations which show that as a team the Tigers allowed 30 more runs than would be expected.
Here are some other defense related Tiger stats:
From the Hardball Times Baseball Annual:
-The Tigers line drive allowed percentage is 17.5% against a league average of 18.2%. This is signifcant because line drives are the type of ball in play most likely to turn into a hit.
-The Tigers groundball/flyball ratio is 1.25 against a league average of 1.15.
-The Tigers had 144 errors last year and 48.5% were throwing errors. The league average is 46.5% of errors are throwing errors.
-From a catching standpoint, the Tigers caught stealing rate was 37% against a league average of 32%. Pudge however only threw out 29% of runners while Brandon Inge threw out 38%. However Pudge’s reputation kept runners from trying to steal on him. With Pudge behind the plate runners tried to steal only .48 times per game. With Inge behind the plate they were trying 1.38 times per game.
Other Stuff
-Happy 4th Birthday to Tigers Central. Ryan and his crew do a great job over there.
-I received a bunch of emails from different website operators who want me to link to them. I’ve read your emails, I just haven’t had a chance to incorporate your links yet.
Tiger DiPS
Jay Jaffe at Futility Infielder has compiled and published Defense Independent Pitching stats for 2004. As I always do when I see fresh stats, I scroll to find out if there is anything interesting to be learned about Tiger players. Fortunately for Tiger fans, there is some good news in here. But first, a little DiPS background.
For those that haven’t heard about Defense Independent Pitching it is an idea promoted/discovered by Voros McCracken. The theory is that pitchers do not differ significantly in their ability to prevent hits on balls in play. DiPS is a way of looking at the things that a pitcher can control without the help of defense (strikeouts, walks, homers, hit batsmen) and combining it with league averages for balls in play to see what a pitcher’s stats would look like with typical “luck” and a typical defense behind him. It is also adjusted for park effects. The resulting calculated ERA (noted as DiPS or FIP, or dERA) has been shown to correlate better with the subsequent season’s ERA, than using the traditional ERA. This is just a very quick explanation. For more detail be sure to read Jaffe’s article that accompanies the stats.
As for how this applies to the Tigers, the following table has the defense independent stats for the Tigers’ starters last year. Defense independent ERA is dERA. Earned runs above replacement is a measure of how many runs better than a replacement level pitcher the pitcher was last year. The d-E column is a measure of how the DiPS stats compare to the actual ERA. A negative number indicates that the pitcher was hurt by some combination of bad luck or bad defense.
Most surprising on this list is Jason Johnson, who was widely regarded as the Tigers’ weakest starter last year (despite a handful of very impressive performances). Johnson was among the league leaders in misfortune last year with an actual ERA three quarters of a run higher than his dERA. With a league average dERA of 4.63, it actually makes Johnson an above average pitcher. One pitcher who had even more bad luck was Derek Lowe who’s dERA was a full run lower than his actual ERA. His dERA of 4.40 is almost identical to Johnson’s. Fortunately, it will cost us $4 million for one more year for Johnson’s services as opposed to $36 million over 4 years for Lowe’s.
Jeremy Bonderman’s dERA of 4.37 is a big improvement over last year’s 4.81. At the age of 22 it is another indication that this guy maybe on the road to stardom.
Mike Maroth’s dERA is .44 worse than his actual ERA. However, he still showed great improvement last year as his 2003 dERA was 5.54.
By dERA Nate Robertson was a slightly below average pitcher last year. It was only his first full year in the rotation however. He struckout plenty of guys, but was hurt by home runs and some fatigue down the stretch.
So the good news is that while the Tigers didn’t have a dominant starter last year, the guys 1-4 were all average to above average. Also, all the Tigers starters showed improvement over the previous year. The bad news is that the Tigers pitching staff was victimized by poor defense. In looking at dER’s and actual ER’s there is a gap of 30 runs. Unfortunately the Tigers weren’t able to significantly bolster their defense this offseason.
Central Park Factors
A couple posts ago I looked at an article that Rob Neyer wrote about how Derek Lowe may be a good fit for Dodger Stadium. I then made the comment that he wouldn’t be a good fit for the Tigers because Comerica yielded few homers and lots of other extra base hits. Of course I made that comment based completely on subjective gut opinion.
I decided to take a closer look at how Comerica park actually played last year. It turns out that Comerica, while it did yield more triples than any other park, was actually the second hardest place in the majors to get a double. I don’t have a clue as to why this is. It may be that some of the doubles turn into triples because of the depth of centerfield. It may be that because the outfield is so spacious the outfielders play deeper an will concede some singles to reduce doubles. I’m not sure what the cause is, but it is interesting nonetheless.
I took it a step further and decided to look at how all 5 parks in the AL Central play. This is relevant because the Tigers will play about 70% of their games between Comerica, US Cellular, the Metrodome, Kauffman, and the Jake. Based on ESPN’s park factor statistics, I compiled the following table of how each stadium ranks for each type of event:
If ever there was a division for a fly ball, home run prone pitcher to have success in (or hide), it would be the Central. With the exception of the launching pad that is Chicago’s US Cellular Field, the other stadiums all rank in the bottom third of the majors in homers allowed.
While from a runs perspective the Metrodome is a hitters park, it isn’t a slugger’s paradise. Across the board it doesn’t yield a lot of extra base hits. I’m guessing that the Metrodome allows more turf fueled singles than its counterparts.
The Jake is a tough place to find a hit, unless it’s doubles you’re looking for. For some reason it is also one of the top places to get a walk. Kauffman meanwhile, has a similar, though less dramatic effect, as Comerica when it comes to extra base hits.
This homerun suppression across the division (of course Chicago is the exception) may be another reason that players are staying away from the Central. It is also a reason to be cautious when pursuing Magglio Ordonez who, while still a very good hitter, has probably benefitted from his home park.
Other Stuff
-To make room for Vance Wilson on the 40 man roster, the Tigers DFA’d Alexis Gomez last week. Today he was outrighted to Toledo. He will be invited to spring training as a non-roster invitee.
-When I’ve covered Tigers’ roster composition in the past, I’ve mentioned that they only have 3 players signed beyond next year. That’s almost correct. Dmitri Young has two option years remaining. The option in 2006 is for $8.5 million, and 2007 is $7 million. I’m not sure about the type of the option for the second year, but the 2006 option is based on playing time in 2005. Unfortunately I don’t know what the game or plate appearance threshold is for that to kick in.