With the Tigers dropping to 0-5 in one run games this year, the fans are getting restless. Exacerbating the situation is the fact that the Tigers were 12-27 last year in one run contests. Of course it is necessary to assign blame. Typically success or failure in close games is attributed to the bullpen, the manager, clutch hitting, and luck. While there maybe some element to each of those, I’m more inclined to attribute it too luck. Also, the other tenet that is always voiced is that “good teams win those close games.” But is that true?
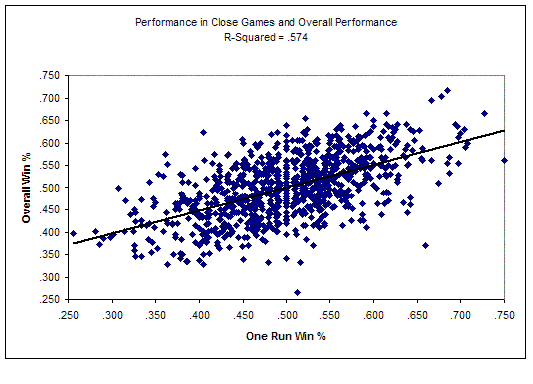
Using data from Retrosheet, I looked at every team’s performance in one run games from 1970 to 1993. The result is 903 team-seasons of data to look at. The first thing I wanted to look at was if good teams, that is teams with high winning percentages, performed well in one run games as well. The chart below shows a plot of one-run winning percentage against overall winning percentage.

You can see that there is a linear trend, and the resulting correlation is .57. (here’s a primer on correlations: two sets of data are compared and given a score. The score is between -1 and 1. The closer the number is to -1 or 1, the stronger the correlation. A value of 0 indicates no correlation) Of course a corerlation would be expected because the record in one run games contributes to the overall winning percentage. On average teams have one-quarter to one-third of their games be decided by a run or fewer, so the correlation makes sense.
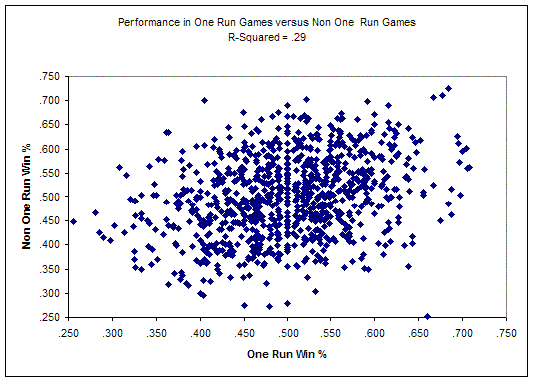
To look at it another way, I plotted each one-run winning percentage against non one-run winning percentage.

This graph lacks any sort of linear relationship. The correlation between the two is non existent with a r-squared of .085 (EDIT: I rechecked and the R-squared value is .29. So the relationship isn’t non-existent, just weak). My interpretation of this is that the teams that fare well in the majority of their games are the better teams. The fact that there isn’t a relationship between the performance in one run games and non one run games leads me to believe that good teams aren’t defined by their performance in the close ones. Good teams can have great seasons by performing well in one run games (ie the 1984 Tigers were 104-58 overall, and 25-11 in one-run games). Similarly a marginal team can have a good season by performing well in tight games. From this it seems that teams are deemed good by winning close games, and not that teams win close games because they are good.
The thing to remember with one run games, is that both teams are within a run of the win. Because the games are tight a lot of emphasis is placed on managerial moves at the end of the game, the performance of the bullpen, and clutch hitting. Given that there will always be tradeoffs. Did a team that came back from a deficit do so because of their clutch hitting or a failure of the other team’s bullpen? Where do you assign credit or blame? Similarly with managerial moves, the manager can call the correct strategy only to have the players fail to execute it. On the other hand, the manager can make some bad decisions that payoff. Luckily there is something easy we can turn to: luck.
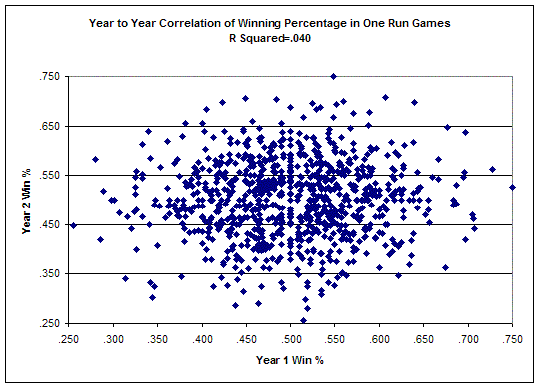
If the ability to win close games was a skill, one would expect teams to be able to repeat it year to year. While personnel and managers may change from season to season, teams generally return largely intact. Using this assumption, I took a look at if there was a correlation between a team’s performance one year and the subsequent year.

As you can see there is no correlation from one year to the next. The r-squared value of .040. I also looked to see if things were more correlated out at the extremes, like the ability for a really good or bad one-run team to repeat their performance. Even at the extremes there was no correlation (~ .075). This leads me to believe that performance in one run games has more to do with luck and less to do with skill.
So what does this mean for the Tigers who’s .325 one-run winning percentage was the 13th worst since 1970? Since it is pretty rare for a team to perform that badly once, chances are the Tigers will do better. Of the 83 teams who had a one-run winning percentage less than .400, only 4 were worse the following season. In fact, of those 83, forty of them posted a .500 or better winning percentage in one-run games the following year. Now the Tigers 0-5 start this season has put them in a hole for finishing over .500, but the Tigers stand a good chance of improving over last year. Furthermore, much of it will come down to luck as opposed to a failure of the offense, bulllpen, or the manager.


