Category Archives: Research

One more post on Comerica’s outfield

There are a few items that didn’t fit into the other posts about the outfield park factors that I wanted to wrap up.

First I wanted to acknowledge some other work that was done. Chone calculated outfield park factors in the fall of 2006. I either missed this or completely forgot having seen it.

Also, Dan Fox continues to post about simple fielding runs and has now calculated the metric for the outfielders, which include outfield park factors. What I found surprising in Dan’s work is that using SFR Curtis Granderson ranks below average. It’s the first defensive metric I’ve seen that has him ranking poorly. Comerica’s outfield park factors that show fewer balls dropping in, adjusts his SFR downward because in some respects Comerica’s centerfield is a little easier to play.

A more detailed look at Comerica

When I was doing the other park factors, I was doing it at a broader level. Fox was breaking it down by hit type and batter handedness. I had pulled back that data as well and thought it was worth looking at a more granular view. The table below reflects Comerica Park’s park factors for the last 4 seasons.

Comerica Park Outfield Park Factor

Lee commented in the original post that he was curious to see what would happen with line drives because Comerica Park has a reputation as being great for line drive gap hitters. This seems to hold true for lefties who see more balls than normal drop into the corner outfield spots. But for right handers the opposite is true.

Meanwhile right handed hitters are best served to drive the ball to centerfield which is the only field that is favorable for them.

I find it interesting that fly balls to center rank so well for righties while they rank poorly for lefties. I wonder if this is a case of positioning and that perhaps the fielders are over shifting. It’s also worth reiterating at this point though that we don’t really know where the balls are being hit using this data. We just know who ultimately fielded the ball.

Outfield Park Factors part 2

Earlier in the week, I questioned the widely held belief of whether with an outfield like Comerica Park’s the Tigers should have 2 centerfielder-types to man the large left and center fields. Using park factors and looking at the rate at which balls in the air drop in for hits, we saw that fewer balls drop in in left and center at Comerica Park, while more tend to fall in right field. Now we’ll take a look at what happens when the balls do drop in.

Again I will turn to park factors. And again I will borrow from Dan Fox and use a metric that is total bases per baserunner. And like the previous analysis, I focused on balls in the air.

The tables below represent the park factors for each of the areas of the outfield, as well as an overall rate. (click the chart for a larger image)
Outfield Park Factors Extra Bases

Here’s where the Comerica Park we know and love comes out. There is more extra base goodness in Comerica Park’s center field than any other stadium, and not surprisingly it comes in the form of triples. Over the last 4 years 8.7% of all triples hit to center field in the Majors have come in Detroit. Here is the distribution of hit type on balls fielded by the center fielder:

	1B	2B	3B
MLB	68%	28%	5%
DET	63%	25%	13%

If the ball gets to the wall, only the slowest of the slow runners aren’t going to end up with a triple. While it’s not surprising to see doubles turned into triples, it is a little surprising to see so many singles turned into triples. It must be a function of the fact that centerfielders play relatively shallow cutting off many would be singles which does correspond with the earlier data where fewer balls drop into center field at Comerica.

But back to the original question about the difficulty of playing left field in Detroit, the data just doesn’t bare that out. Fewer balls drop for hits, and there are fewer bases per baserunner in left field. In right field we see a few more balls dropping for hits, but it is one of the toughest fields to get extra bases. Perhaps the right fielders are playing too deep?

While having multiple outfielders with above average speed and range is never a bad thing – especially in larger parks of which Comerica Park definitely ranks – there isn’t anything about Comerica’s left field that makes it any more necessary than in any other stadium. While the argument for “2 centerfielders” can certainly be made, it really only looks like it would help if they were both manning center at the same time.

The information used here was obtained free of charge from and is copyrighted by Retrosheet. Interested parties may contact Retrosheet at www.retrosheet.org

Comerica Park’s outfield is so big…

“How big is it?”

You need 3 center fielders to cover all the ground out there

Okay, as a joke it’s awful, but it is a common statement amongst Tigers fans. At the very least the belief is that multiple center fielder type players are required to man left and center fields. When you look at the massive expanse of green, it certainly seems believable. But when I go through the game rolodex in my head, I don’t recall an inordinate number of balls landing in the left-center gap. Center field is a massive piece of real estate, but since the ball park was reconfigured left field seems quite manageable. Does Comerica really play as big as it’s reputation in left and center fields?
Continue reading Comerica Park’s outfield is so big…

Fish Eye on the Tigers

Dan Fox at Baseball Prospectus recently did a post where he used the enhanced gameday (aka pitch/fx) data to categorize hitters by eye. He broke hitters down into the following groups and subsequently created some pretty slick graphs.

  • Square: This is the new metric, defined as the percentage of pitches in the strike zone swung at and made contact with. A high value here (relative to the average of over 87 percent) indicates that when the batter offers at a strike he usually makes contact. On the contrary, a lower value indicates hitters who, for reasons such as a long swing, are more apt to swing through strikes.
  • Fish: Defined as the percentage of pitches out of the strike zone that the hitter swung at. A higher percentage here indicates that the hitter may have trouble recognizing pitches since he is offering at pitches that would likely be called balls. Average values here are between 32 and 33 percent.
  • Bad Ball: Defined as the percentage of pitches out of the strike zone that were swung at where contact was made. This includes foul balls, although there is an argument to be made that a foul ball is not the intended outcome, and so should be discounted in some way. A higher value in this category indicates that, when swinging at bad pitches, the hitter is at least able to get the bat on the ball. Average values lie around 73 percent.
  • Eye: Defined as the percentage of pitches in the strike zone on non-three and zero counts that were taken for strikes. A smaller value in this metric indicates a player who recognizes strikes and aggressively offers at them. I excluded 3-0 counts, since a hitter is much more likely to let a strike go by in this situation, and we don’t want to penalize them for that behavior. Average values here are in the range of 25 to 27 percent.

While Detroit Tigers hitters were included in the analysis, it was tough to tease out exactly where they fell. Inspired, I thought I do the same analysis but focus on the Tigers. My numbers didn’t work out exactly the same as Fox’s, but the categorization of the players seemed to be fairly consistent. One reason for the disparity on the Eye metric is that the way I parse the data, I didn’t have the count readily available so I didn’t filter out taking on 3-0. The other discrepancy is probably the width of strike zone used. Fox said he used the 17 inch wide plate. Because only a portion of the ball has to cross the plate for a strike, I included the radius of the ball on either side of the plate as well. I’m also not sure how he included bunts and bunt attempts or being hit by a pitch. Regardless, the points remain the same.

As for the specifics on how the numbers differed, here are the league averages I calculated for each:

  • Square: 86%
  • Fish: 29%
  • Bad Ball: 70%
  • Eye: 36%

Fox then graphed Fish value against Eye values which put hitters into one of four categories. The graph of just the Tigers hitters is below:

Tigers batting eye

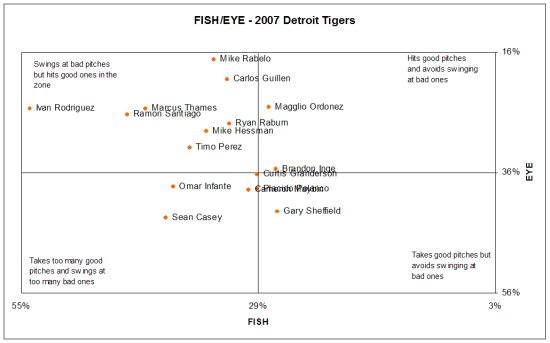
The first things that jump out in these types of graphs are the outliers. I don’t think that anyone is surprised that Pudge Rodriguez swings at more pitches out of the zone than anyone on the team. In fact, he swings at more than anyone in Major League Baseball.

What may surprise though is Sean Casey being in the lower left quadrant. Casey doesn’t strike out a whole lot, but he tends to swing at the bad pitches and take the good ones. The other surprise, especially given his strikeout rates, is Brandon Inge who is better than many of his peers in swinging at the pitches he should swing at and taking the ones he shouldn’t. Of course check swings where you go to far are still counted as swings so make of that what you will.

The last thing to notice is pretty much a team wide trend, and that is that the team tends to lean towards to the left, and that they are more likely than a typical team to chase pitches out of the zone. Even those players in the more patient hemisphere still are towards the middle. On a team level it confirms what pretty much everyone suspected based on observations.

The table below has the numbers for each of the Tigers:

Player			SQUARE	FISH	BADBALL	EYE
Brandon Inge 84% 27% 54% 35%
Cameron Maybin 80% 30% 40% 39%
Carlos Guillen 86% 32% 73% 20%
Curtis Granderson 89% 29% 63% 36%
Gary Sheffield 87% 27% 79% 42%
Ivan Rodriguez 81% 54% 77% 25%
Magglio Ordonez 88% 28% 76% 25%
Marcus Thames 73% 41% 63% 25%
Mike Hessman 82% 35% 65% 29%
Mike Rabelo 83% 34% 74% 17%
Omar Infante 84% 38% 79% 38%
Placido Polanco 96% 29% 89% 39%
Ramon Santiago 86% 43% 73% 26%
Ryan Raburn 77% 32% 60% 28%
Sean Casey 95% 39% 84% 43%
Timo Perez 88% 37% 84% 32%
Team 86% 33% 72% 32%

Baseball Prospectus | Articles | Schrodinger’s Bat: The Return of the Fish Eye

Mike Rabelo – the anti-save

I don’t know if you’ve noticed or not, but Todd Jones and Mike Rabelo don’t really go together. If Jones is peanut butter, Rabelo is asparagus and if you look back at the game logs you see that Mike Rabelo has caught half of games where Jones has allowed runs. Luckily it seems that Jim Leyland has picked up on this, and has Ivan Rodriguez catch Jones in his last 13 appearances. A period where Jones has allowed a meager .490 OPS against.

On June 26th the Tigers were hosting the Rangers at the beginning of a lengthy homestand. Todd Jones entered the game in the 9th inning with the score tied at 6 after the Tigers scored 3 in the bottom of the 8th. After 2 quick outs Jones allowed a few baserunners and there seemed to be a conference between every single pitch with catcher Mike Rabelo. A triple and a single later the Tigers were down 3. After the game Jones admitted to missing a sign from Rabelo. He was supposed to step off the rubber, and instead gave up a hit. That was the last game that Rabelo has caught Jones.

And I’m pretty sure this isn’t a matter of coincidence. Twice Rabelo was the starting catcher, only to be replaced by Pudge at the end of the game for defensive purposes.

Looking back, Jones has allowed runs in 10 of his apperances and in 5 of those Mike Rabelo was the catcher. Jones has 5 blown saves, and Rabelo was manning the plate for 3 of them. Remember April 18th against the Royals? The Tigers take a 3-1 lead into the 9th inning. Jones walked 2 and allowed a double and a single tying the game.

Or what about May 28th against the Devil Rays? The Tigers have a 5-4 lead when Jones loads the bases on 2 hits and an intentional walk only to see Elijah Dukes single in the winning run on a chopper. Rabelo.

And who could forget the low point of the season (at least the low point before this week). The debacle on June 1st in Cleveland. Jones allowed 5 runs in the bottom of the 9th for a crushing 12-11 defeat. Rabelo.

In all, 12 of the 23 runs Jones has allowed have come with Rabelo behind the dish, which is disproportionately high for the backup catcher.

I don’t mean this as an indictment of Rabelo’s ability. His overall catchers ERA is 4.66 which is only slightly higher than Pudge’s 4.47. Given Rabelo’s limited playing time I’m not sure that is even a real difference. But for some reason, he and Jones just never seemed on the same page. They seemed to confer on a regular basis, and the Rangers game was just a manifestation of that. So if the game is close, and Rabelo is playing, you’ll probably continue to see Pudge get that 9th inning call.

A different look at Andrew Miller

On Sunday, June 24th Andrew Miller took center stage on ESPN Sunday Night Baseball and promptly pitched 6 shut out innings. Miller only allowed 4 hits and 2 walks and was never really threatened. Was this a dominant performance by a young stud pitcher, or just another day at the office for the slumping Braves? I don’t know if we can really say one way or the other, but with enhanced gameday data we can at least get some additional information.
Continue reading A different look at Andrew Miller

A different look at the Bonderman-Halladay Duel

Taking advantage of the enhanced gameday data once again, I’ll take a look at Jeremy Bonderman’s and Roy Halladay’s awesome performances last night.

We’ll start with Jeremy Bonderman. The table below shows the mix of pitches and results for Bonderman:

It was a little surprising to see that Jeremy Bonderman didn’t miss that many bats last night, and none with his fastball. But what he did was induce a ton of weak contact. This was probably one of the biggest factors in keeping his pitch count so low.
Continue reading A different look at the Bonderman-Halladay Duel

A different look at Zumaya’s outing

I think everyone was mighty blown away by Joel Zumaya’s 2 inning save last night. He pounded the strike zone with 100mph plus heaters and buckled knees with his curve ball. But just for fun, and because we can, let’s take a look at all the pitches that made up his night.

I don’t know if you noticed in the playoffs last year, but MLB Gameday started using an enhanced version that had camera’s catching the path of the pitch, the velocity, and the release point. This was kind of a neat feature, but what makes it gold is that the data is captured and stored on MLB.com’s servers. Inspired by the book Baseball Hacks: Tips & Tools for Analyzing and Winning with Statistics, and with some programming of my own, I worked this offseason to be able to capture and analyze this data. Imagine my disappointment when after the first 8 games the Tigers hadn’t had an “enhanced” game. Fortunately they did last night.
Continue reading A different look at Zumaya’s outing

Battling with two strikes

Jim Leyland has 2 priorities this season. First he wants to improve baserunning. On that front it seems like he was reading Detroit Tiger Tales’ analysis. His other initiative is improving the Tigers batters approach when they are presented with a two strike count. The Tigers strike out a lot, which means they get to, and struggle with their share of 2 strike counts. But are they really worse than the rest of the league when down in the count?

The following table shows both the Tigers stats when the count reaches 2 strikes, as well as all of MLB in 2006.


Continue reading Battling with two strikes

Examining Depth of Plate Appearances

Certainly there is more to plate discipline than first pitch swinging. We’ve seen that the Tigers aggressiveness in that regard actually pays dividends. We also know that the Tigers strike out more than any other team in the American League and walk less than only the Cubs and Mariners. One hazard of first pitch swinging is that it short circuits long at-bats, but is there a benefit to working deep into the count?
Continue reading Examining Depth of Plate Appearances