Category Archives: Offense

Tigers have nocturnal bats

With this afternoon’s loss to the Blue Jays the Tigers record in day games now stands at a remarkable 0-10. A quick check of the splits reveals that the Tigers have been outscored 57 to 18 in day games. Yes, the offense has mustered less than 2 runs a game before the sun sets.

After dusk the Tigers are 6-3 and have scored 59 runs while allowing 60. So the pitching has been pretty inadequate no matter what time it is. The differences in offense however are dramatic to say the least. The following numbers aren’t inclusive of the Sunday tilt:
Tigers can\'t hit during the day
Continue reading Tigers have nocturnal bats

The Coda

Wrapping up some outstanding items from what very well could be one of the most significant trades in franchise history…

Replenishment

Peter Gammons astutely pointed out that the Tigers were able to make this trade because of Ilitch’s and Dombrowski’s refusal to adhere to the asinine draft slotting system. Not only did a willingness to pay above slot money directly allow for the acquisition of main trade chits Andrew Miller and Cameron Maybin, it also meant that a this type of aggressiveness meant that the Tigers cupboard – while depleted – isn’t bare.

Many of the Tigers new top prospects are the product of slot-buster signings in the most recent draft. Headlined by Rick Porcello, the group also includes Cale Iorg and Casey Crosby among others.

The question then becomes how long can this remain an advantage for the Tigers? Surely other organizations have taken notice of the Tigers strategy, and it’s not that different than what other big market clubs have done. While some teams will still religiously adhere to the slotting system, I have to believe that more teams adopt a more aggressive stance on acquiring top shelf talent early on.

Will the Tigers be able to reload quickly by just outspending on the draft? I don’t mean to minimize the work that David Chadd and his scouts do, because it is easy to make bad decisions with big piles of money. But when you’re willing to spend what it takes to get Maybins and Millers and Porcellos, it certainly improves your chances for success.

On the defensive

I just wanted to do a quick follow up on the value of Cabrera’s defense. It was a hot topic here on Friday and commentor Ryan S pointed out that PMR thought Cabrera was okay in 2006. I should have looked at more than one year of data, and in my haste I got a little sloppy. In terms of run value PMR had Cabrera at +5.2 runs in 2006 at the hot corner. Perhaps Cabrera isn’t awful, and simply underperformed in 2007 due to his weight gain, or the crappy Florida environment.

Taking it a little further I also looked at UZR numbers for Cabrera. In 2006 he rated -14 runs per 150 games. That happened to be the worst rating for third baseman who played at least 120 games. In 2007 UZR rated Cabrera as the worst third baseman in the National League at -28 runs while Brandon Inge ranked tops in the AL at +12.

As for his outfield prowess, he was merely below average in UZR splitting time between left and right field in 2004, but was -21 runs per 150 games while manning left in 2005.

Continue reading The Coda

Where should Cabrera play?

Jim Leyland was quoted yesterday talking about how this deal and the players they acquired were like a presents under the tree. Well, now that we can open up the presents, it’s time to play with them. The common refrain is that the Tigers should play Miguel Cabrera at third base and move Brandon Inge. It’s pretty clear that Cabrera is better than Inge and I’m not going to try and dissuade you from thinking that way. But as both Rob Neyer and Lee Panas have pointed out, the chasm in defensive ability between the two makes the upgrade not as dramatic as it appears at first blush. Are the Tigers better served putting Cabrera in left field?

Continue reading Where should Cabrera play?

Playing in the spray

I love looking at spray charts of batted balls and seeing where hitters have success. I’m funny like that. Fortunately Dan Fox, proprietor of his own blog and writer for Baseball Prospectus has released an application that shows ball in play distributions for the last 4 years and he just released the updated version including 2007 data. With the heavy lifting done for me, I thought I’d take a look at 3 of the Tigers more interesting hitters from the last year.

Brandon Inge

First up is the ever controversial Brandon Inge. Inge had an awful season at the plate as he posted a meager 236/312/376 line. Part of his problem was what seemed to be an endless supply of check swing strikeouts. And that appears to be the largest difference over the past few years. Inge’s batting average on balls in play was .334 which wasn’t out of line with his past performances. His batted ball distribution didn’t differ greatly from his fairly productive 2006 season.

BABIP GB FB LD PopUp
2003 R 0.262 44.8% 31.3% 17.9% 6%
2004 R 0.344 42.6% 30.3% 19.4% 7.6%
2005 R 0.333 39.5% 34.3% 18.7% 7.6%
2006 R 0.324 39.9% 34.1% 15.1% 10.9%
2007 R 0.334 37.9% 31.8% 20.6% 9.7%

Inge actually upped his line drive rate and had a small improvement in his pop up rate, yet his overall performance dipped.  Maybe he was a little unlucky like he claimed earlier in the season?

Another complaint about Inge is that he became too pull happy.

Left Center Right
2005 41.0 28.3 30.6
2006 48.1 27.0 24.8
2007 48.1 22.0 29.8

Inge did become more of a pull hitter in 2006 and it worked to his benefit as he slugged .463 and 27 balls left the park.  He pulled just as much in 2007 but with a lot less success and a lot less power.  We also saw Inge go to the opposite field more often, but it was at the expense of going up the middle.  Based on observation and the data, it seems like it was more a function of Inge being late than looking to punch the ball to right.

Curtis Granderson

Nobody complained about Granderson pulling the ball too much, and he actually was more likely to pull the ball than Brandon Inge was. Of course, when you’re among the league leaders in extra base hits it doesn’t really matter where you hit the ball.

GB FB PU LD %
Left 25 45 26 16 25.2%
Center 25 57 4 19 23.6%
Right 116 40 10 62 51.2%

With Granderson’s proclivity for pulling the ball on the ground, it wouldn’t surprise me to see more teams shifting the shortstop closer to second base. I wouldn’t expect an Ortiz type shift because of Granderson’s speed and ability to bunt, but Curtis did hit .600 on grounders through the middle in 2007.

Magglio Ordonez

It seems that any look at Tigers performances isn’t complete without at least glancing at how Ordonez fared. It was a popular refrain from Rod Allen that Maggs was using the whole field, and it really was true. Ordonez hit 42% of his line drives to right field. And overall he hit the ball to right field as much as he hit it to left.

GB FB PU LD %
Left 126 14 8 34 37%
Center 32 51 4 30 24%
Right 62 65 18 46 39%

That kind of balance made it impossible for any team to load up one side. And in a spacious outfield like Comerica Park that gave Ordonez a lot of room to work with. Now granted he was still lucky in 2007. You don’t exceed career norms by that much without some things going your way. In the case of Ordonez it was a .318 batting average on ground balls and a .361 batting average on fly balls. MLB norms for the last 4 years were .233 and .272 respectively.

There’s a ton of information available, and it’s all free. So thanks to Dan Fox for his hard work, and let me know if you see anything interesting.

Fish Eye on the Tigers

Dan Fox at Baseball Prospectus recently did a post where he used the enhanced gameday (aka pitch/fx) data to categorize hitters by eye. He broke hitters down into the following groups and subsequently created some pretty slick graphs.

  • Square: This is the new metric, defined as the percentage of pitches in the strike zone swung at and made contact with. A high value here (relative to the average of over 87 percent) indicates that when the batter offers at a strike he usually makes contact. On the contrary, a lower value indicates hitters who, for reasons such as a long swing, are more apt to swing through strikes.
  • Fish: Defined as the percentage of pitches out of the strike zone that the hitter swung at. A higher percentage here indicates that the hitter may have trouble recognizing pitches since he is offering at pitches that would likely be called balls. Average values here are between 32 and 33 percent.
  • Bad Ball: Defined as the percentage of pitches out of the strike zone that were swung at where contact was made. This includes foul balls, although there is an argument to be made that a foul ball is not the intended outcome, and so should be discounted in some way. A higher value in this category indicates that, when swinging at bad pitches, the hitter is at least able to get the bat on the ball. Average values lie around 73 percent.
  • Eye: Defined as the percentage of pitches in the strike zone on non-three and zero counts that were taken for strikes. A smaller value in this metric indicates a player who recognizes strikes and aggressively offers at them. I excluded 3-0 counts, since a hitter is much more likely to let a strike go by in this situation, and we don’t want to penalize them for that behavior. Average values here are in the range of 25 to 27 percent.

While Detroit Tigers hitters were included in the analysis, it was tough to tease out exactly where they fell. Inspired, I thought I do the same analysis but focus on the Tigers. My numbers didn’t work out exactly the same as Fox’s, but the categorization of the players seemed to be fairly consistent. One reason for the disparity on the Eye metric is that the way I parse the data, I didn’t have the count readily available so I didn’t filter out taking on 3-0. The other discrepancy is probably the width of strike zone used. Fox said he used the 17 inch wide plate. Because only a portion of the ball has to cross the plate for a strike, I included the radius of the ball on either side of the plate as well. I’m also not sure how he included bunts and bunt attempts or being hit by a pitch. Regardless, the points remain the same.

As for the specifics on how the numbers differed, here are the league averages I calculated for each:

  • Square: 86%
  • Fish: 29%
  • Bad Ball: 70%
  • Eye: 36%

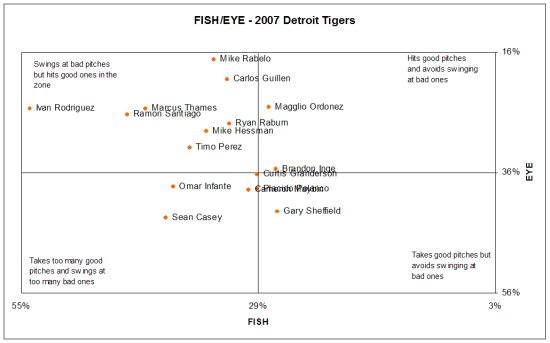
Fox then graphed Fish value against Eye values which put hitters into one of four categories. The graph of just the Tigers hitters is below:

Tigers batting eye

The first things that jump out in these types of graphs are the outliers. I don’t think that anyone is surprised that Pudge Rodriguez swings at more pitches out of the zone than anyone on the team. In fact, he swings at more than anyone in Major League Baseball.

What may surprise though is Sean Casey being in the lower left quadrant. Casey doesn’t strike out a whole lot, but he tends to swing at the bad pitches and take the good ones. The other surprise, especially given his strikeout rates, is Brandon Inge who is better than many of his peers in swinging at the pitches he should swing at and taking the ones he shouldn’t. Of course check swings where you go to far are still counted as swings so make of that what you will.

The last thing to notice is pretty much a team wide trend, and that is that the team tends to lean towards to the left, and that they are more likely than a typical team to chase pitches out of the zone. Even those players in the more patient hemisphere still are towards the middle. On a team level it confirms what pretty much everyone suspected based on observations.

The table below has the numbers for each of the Tigers:

Player			SQUARE	FISH	BADBALL	EYE
Brandon Inge 84% 27% 54% 35%
Cameron Maybin 80% 30% 40% 39%
Carlos Guillen 86% 32% 73% 20%
Curtis Granderson 89% 29% 63% 36%
Gary Sheffield 87% 27% 79% 42%
Ivan Rodriguez 81% 54% 77% 25%
Magglio Ordonez 88% 28% 76% 25%
Marcus Thames 73% 41% 63% 25%
Mike Hessman 82% 35% 65% 29%
Mike Rabelo 83% 34% 74% 17%
Omar Infante 84% 38% 79% 38%
Placido Polanco 96% 29% 89% 39%
Ramon Santiago 86% 43% 73% 26%
Ryan Raburn 77% 32% 60% 28%
Sean Casey 95% 39% 84% 43%
Timo Perez 88% 37% 84% 32%
Team 86% 33% 72% 32%

Baseball Prospectus | Articles | Schrodinger’s Bat: The Return of the Fish Eye

Comerica Hitters Park

The Tigers offense has been getting all kinds of well deserved pub. They’re averaging 6 runs a game. Little did we know that their pitcher’s paradise has played as a hitters haven so far in 2007.

Ever since Comerica Park opened in 2000 it has been cited as a pitcher’s park. While it did suppress run scoring a little, it’s always been possible for offenses to generate a decent batting average. Still, that spacious centerfield and deep left field have always suppressed homers. And when the left field fence was brought in it helped to even things out for the sluggers, but still it played to the pitcher’s advantage. Until this year.

Park Factors help to provide context to offensive events by comparing the offensive events in a home stadium to those on the road. I calculated the 2007 factors using the method described in the Bill James Handbook. In the case of homers, you add all the homers hit by the Tigers and their opponents in Comerica Park and dividing by the number of at-bats between the 2 teams. That number is then divided by the same calculation for when the Tigers are on the road and playing in their opponents parks and the result is multiplied by 100. A value of 110 would mean that it is 10% easier to achieve the feat at home, where a figure below 100 means that the park suppresses the event.

The table below shows the Comerica Park park factor for 2007, as well as the 2004-2006 seasons. The previous seasons were taken from the Bill James Handbook.

		2007	04-06
Runs		110	 95
Hits		101	102
Doubles		102	 86
Triples		114	155
Homers		117	 86

A couple things to note:

  • Comerica is widely regarded as a great doubles park, and that is largely unfounded. Even this year it is barely above neutral.
  • With batting average remaining pretty consistent, the increase in Comerica scoring has to be attributed to the increase in homers, and to a lesser extent doubles.
  • Triples are down, but they are a rare enough occurrence and it is early enough in the season that 2 or 3 triples could really swing this. I have full confidence that Comerica Park and Triplesville will still produce plenty of 3 baggers.
  • Related to triples, Curtis Granderson has single handedly impacted this metric with 10 of his 12 triples coming on the road.

I don’t mean to diminish the quality of the offense by attributing it to Comerica Park. The team is still hitting 289/349/472 on the road so the offense is just flat out good. We’re still barely more than a third of the way through the season, so it remains to be seen how this will play out. But for a park that has always played big in the past, it sure is playing small now.

Contacting Polanco

This is something that I actually started tracking a few days ago, but Placido Polanco is off to quite the start this year making contact. Polanco has always been a tough strike out, and for his career he’s made contact with 91% of his swings. For some context, the average is 80%. But this year has been different for Polanco. Going into Monday’s game, Polanco was at 98% with only 3 swings and misses.

Sean Forman, who has loads of data available at Baseball Reference provided a list of the top seasonal contact percentages for which there is data available.

Wade Boggs and Marty Barrett are the only players to sustain that kind of contact rate over an entire season. But given Polanco’s history and approach it seems that he could hang with this group for awhile.

Looking at the names on the list, a super high contact rate doesn’t really spell success, but these are pretty incredible regardless.

Now as I was typing this up tonight, Polanco picked up just his 4th whiff of the season. That swing-and-miss broke a streak that, by my count, totaled 113 consecutive swings with contact. That dated back to an April 11th game, also with the Orioles. It’s a streak that was pretty much meaningless, yet amazing at the same time.

Leyland sets lineup and leadoff platoon

It appears that Jim Leyland has settled on a lineup that he might use some of the time depending on the handedness of pitchers. One thing he did settle on though is that for the time being Pudge Rodriguez will lead off against left handers and Curtis Granderson will lead off against right handers.

The knee jerk reaction from much of the sabermetric community will be to look at Pudge’s batting average heavy OBP (332 and 290 the last 2 seasons) and decry the move. But Detroit Tiger Tales earlier showed the splits that indicate this is a tactic worth at least trying. The Tigers with a right handed heavy roster have very little platoon flexibility and this is a way for Leyland to squeeze a little platoon advantage.

Plus, the few times that Rodriguez led off last year, it appeared he tried to show more patience at the plate. Whether or not that is sustainable (he has a lot of career at-bats working against him), and whether or not it leads to better results, are both huge questions. But if Leyland can help the team score more runs, and Rodriguez become a better hit, why not try it?

The lineup he’ll put out against right handers is: Granderson/Polanco/Sheffield/Guillen/Ordonez/Rodriguez/Casey/Monroe/Inge

And according to Danny Knobler, the players seem happy with the lineup, for whatever that’s worth.

As I’ve mentioned before, the order of the players in the lineup matters much less than which players are in it. This is because the Tigers lineup is quite balanced without real standout players, and without real black holes. Besides, Leyland will likely use over 100 different lineups this year. Last year the most common lineup used took the field all of 6 times.

Curtis Granderson and his strike outs

Don’t know if you’ve been following the news out of Lakeland, but it appears that Curtis Granderson struck out a lot last year. It also appears that a goal of the organization is that he strike out less this year. Essentially he just needs to make better contact. And changes in his

There has been a ton of interesting discourse about this over the last few days. Jason Beck notes Granderson comes in with a retooled swing that cuts down on extra movement. John Lowe points out that striking out a lot isn’t necessarily bad, just look at Grady Sizemore.

Leyland made a whole lot of sense when meeting with reporters on Thursday on the subject:

I think he (Granderson) will cut down some (on strikeouts) because he’s going to be a more mature player. But I don’t want to turn him into some get-a-walk, Punch-and-Judy type of guy.”

“I’ve never known how to figure it out. We tell our hitters to be aggressive all the time, and at the same time we tell them, ‘Work the pitcher.’ “

Lowe also quotes Granderson identifying that a more aggressive approach may actually lead to fewer strikeouts

“The simple approach is that if I stay aggressive, I’ll hit less often with two strikes in the count,” he said. “I’ve been aggressive, but I’ve missed pitches. If I can put them in play earlier in the count, I eliminate the two-strike approach.”

I really agree with this. We’ve seen that hitting with 2 strikes is no picnic, and once the at-bat reaches 2 strikes it was over pretty quick for Granderson.

So there is some good stuff on the theory front, but what do the stats say? Detroit Tiger Tales looked at K/BB ratios for the whole team, and Granderson’s K’s out weight his decent walk total and push him into the bottom half of the league. But let’s look a little deeper still…
Continue reading Curtis Granderson and his strike outs

Battling with two strikes

Jim Leyland has 2 priorities this season. First he wants to improve baserunning. On that front it seems like he was reading Detroit Tiger Tales’ analysis. His other initiative is improving the Tigers batters approach when they are presented with a two strike count. The Tigers strike out a lot, which means they get to, and struggle with their share of 2 strike counts. But are they really worse than the rest of the league when down in the count?

The following table shows both the Tigers stats when the count reaches 2 strikes, as well as all of MLB in 2006.


Continue reading Battling with two strikes