(the following was contributed by poster Jeff Molby)
There’s been a lot of talk about “slow starts” and “choking down the stretch” during the Leyland years. With 7 years of data points available, I figured it’s time to see if there’s anything to it.
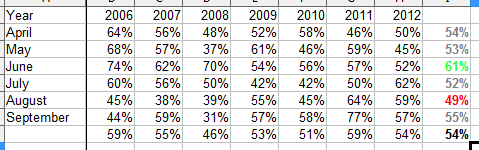
There’s not. I didn’t bother to weight the numbers based on games played, so data isn’t perfectly accurate, but it’s close enough for our purposes. The most you could say is that June is a good month and August is a bad month, but really that’s just because of the volatility (mostly due to injuries) of the 2007 and 2008 teams.
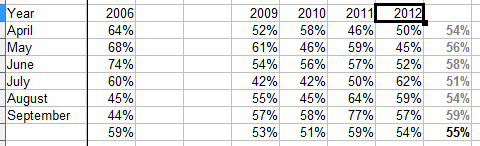
Pull those two years out of the sample and what you have is a team that’s consistently a bit above average. I know I’m viewed as one of the resident apologists, but I remember The Lost Decade all too well. If you had approached me in 2005 and offered a decade of “slightly above average”, I’d have kissed ya and invited ya over for dinner.
Nice work. Now if you could only graph his success on getting guys “going.”
I would just compare each player’s production before, during, and after playing for Leyland. If the “during” is above or below the rest of the player’s career arc, we can consider Leyland to have used that player more effectively than the other managers. Aggregate that for all players that he’s managed and you’d get a meaningful metric for managers.
I don’t think the results would be noteworthy, though, so I’ll save all of that legwork for someone that has an ax to grind.
Are we looking at win percentages here? Sorry if I’ve overlooked something but I don’t know what the tables represent.
Yeah, sorry I didn’t make that clear.
Thanks Jeff. Nice piece, it’s always good to see someone back up their opinions with numbers rather than vague anti-Leyland conjecture.
Happy Jackie Robinson Day to you all! See the movie, it is superb, might be the best Baseball History movie ever made.
Don’t forget “Soul of the Game”, a very underrated straight to TV movie about Jackie Robinson, Satchel Paige and Josh Gibson. It doesn’t look like it’s available streaming on any of the major services but you can buy it from Amazon for like $6.
nice piece.
I was a freshman in college in 1987 (19 years old). That was a long dry spell from ’87 to 2006. and most of it was absolutely hideous…only, what, three winning seasons (88, 91, 93)? and outside of 1988, no real playoff contention.
yes, above average is pretty darn nice in comparison. most of the last 7 seasons have been really fun.
This reminds me of the story about the wannabe comedian who shows up at the Comedy Club on Open Night. The MC introduces him to the audience and then walks off the stage. The comedian begins hs routine:
Comedian: “17”
Audience: ?
Comedian: “22”
Audience: ??
Comedian: “95”
Audience: ???
Comedian: “6”
Audience: ????
Finally the MC rushes back on stage and approaches the comedian:
MC: “What are you doing?” Start your routine!
Comedian: “This is my routine.”
MC: ???
Comedian: “I’ve only got five minutes and I want to get in as many jokes as I can. I keep all my jokes in a notebook and the numbers refer to those jokes.”
Many are the impressions formed with assistance from confirmation bias.
Even with 2007 and 2008 left in, I don’t think a 49%-61% spread is very significant. At any rate, just looking up and down the chart year to year, I see only one “trend” that extends beyond two seasons, and that’s climbing win % July-September from 2009-2011.
OK, I see one more. Falling win % June-August from 2006-2008.
Only 12 of 42 months with losing records, and 4 of those in 2008.
Of course, putting things in the frame of months has an influence. 2012 looks very steady, but I believe there was an 11-21 stretch, probably the longest and most dismal sub-.500.
Deadline trades that worked.
Injuries and deadline trades that didn’t work.
Yeah, but streaks are a fact of life. All you can really control is the aggregate.
Oops, I guess I botched the HTML. “Injuries and deadline trades that didn’t work” was in regards to 2006-2008.
Jeff, I agree with you entirely on the points you made in the article. At first I thought they were even more fully substantiated by the overall lack of any real trends at all, but then I found some minor trends. I didn’t think they really proved anything, but you make a good case for causes. Mentioning the 11-21 stretch was just an aside on how monthly records can mask greater streakiness, not that I find such streakiness much more than random variation when comparing one year to another.