After Justin Verlander’s 130 pitch outing, I flailed wildly in frustration at the stupidity of the situation. I didn’t care for the move from an in game management decision, and I hated the thought of increasing the risk of injury to the prized arm in the organization. The feedback was mixed. Some agreed with me. Others thought I was crazy. Pitchers used to throw a lot more. Justin Verlander was still throwing hard. He’s been throwing a lot of pitches this year so he’s conditioned for it. He hasn’t been injured the in the past. He’s the ace. Some of these arguments don’t hold a lot of water, but others are harder to refute. But what if we table the injury concern for a moment and instead look at performance?
Starting very simple, we can look at Verlander’s performance by pitch count. Baseball Reference breaks this down by 25 pitch increments. For 2008 we are looking at a pretty small sample for pitches past 101, 68 plate appearances so far. But 44% of those PA’s resulted in the batter reaching base safely. With that many baserunners getting on, it means either more pitches due to more batters or more runners left on for relievers to deal with.
I know that the Tigers bullpen has been horrific this year and Jim Leyland is probably hesitant to turn to it. But over 101 pitches Verlander is allowing an 888 OPS against. He walks 13.2% of batters once he’s past that threshold versus 9.5% when he’s below it.
I’m not saying that Verlander should never eclipse the 100 pitch mark, but just because he can handle it from an injury standpoint (which still remains to be seen), Leyland has been leaving him in too long. Perhaps past the point of failure.
Now what really prompted this article, is Verlander’s performance on Monday night. That would be the outing after his 130 pitch performance, and one of Verlander’s worst of the year. I wanted to take a look at Verlander’s pitch count and his results in the subsequent start.
The metric I chose for performance is Game Score. Game Score is a Bill James stat that is calculated like so:
Start with 50 points. Add 1 point for each out recorded, (or 3 points per inning). Add 2 points for each inning completed after the 4th. Add 1 point for each strikeout. Subtract 2 points for each hit allowed. Subtract 4 points for each earned run allowed. Subtract 2 points for each unearned run allowed. Subtract 1 point for each walk.
So picher’s get credit for getting outs, and get penalized for allowing runs and baserunners. It’s not a perfect measure, but it’s a decent gauge of a pitcher’s effectiveness.
I broke the pitch count into 6 categories:
- Cat 1: <100 pitches
- Cat 2: <105 pitches
- Cat 3: <110 pitches
- Cat 4: <115 pitches
- Cat 5: <120 pitches
- Cat 6: >119 pitches
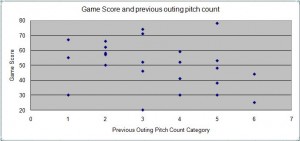
The chart below shows the category for pitch count versus the game score in the following start:

There isn’t a strict, and barely a rough linear relationship here. But there does seem to be a division once Verlander reaches category 4 status (115 110 pitches and more). When he’s below that mark, 10 of his 13 subsequent starts were average (game score 50) or better. Above that mark and 7 of the 11 starts following were below average.
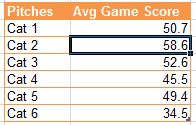
In terms of average game score by category, that table is below:

Again not a straight line relationship, but a degradation after 115 110 pitches.
Now this is isn’t a perfect analysis by any means, and I’m not advocating that whenever Verlander hits 114 109 pitches that Leyland comes running out of the dugout. Things vary start to start, like the weather, the other lineup, how easy he’s gone through the lineup, and the other variables that are probably already taken into account. But for those that are arguing Verlander can handle the workload without problem…it does appear there’s a problem. There’s a problem not only in the start he’s currently making, but more often than not it adversely effects the following start as well.
Great analysis.
Won’t even pretend to understand all of it, but get your drift. It would be great if Justin could be more efficient with his pitches so it wouldn’t get elevated by the 5th inning. Maybe his arm isn’t meant to throw more than 90 or 100 pitches.
This would be interesting to track throughout his career with a larger sample size. Perhaps a linear trend would indeed develop.
I wouldn’t be surprised if Verlander misses his next start. Halladay threw 130 in his last start, and since the Blue Jays are out of contention, he is being skipped this Thursday. I would like to see the Tigers do the same thing with Verlander. It’s time to seriously start thinking for next year.
I was looking at Verlander’s platoon splits 2006-2008. Interesting oddities with HBP data (highlight: ZERO LHB plunked in both 2006 and 2008) and associated slight to moderate correlations.
I found the following stranger still:
IN-PLAY GROUNDBALL % – GDP RATE – GROUNDBALL BABIP
2006 41.3% – 1 every 37 BF – .220
2007 42.5% – 1 every 87 BF – .275
2008 41.8% – 1 every 68 BF – .271
The 0 hit LHB doesn’t surprise me. When Verlander wildly misses with the fastball, he seems to let it go early, causing it to fly out to the right.
Thank you, Brian. It was hard to figure why he wasn’t/isn’t hitting RHB/LHB more evenly, as in 2007, unless he just wasn’t going inside on lefties. Or – as I take from your suggestion – that maybe he overthrows lefties more often.
Are all of my posts started with “I wouldn’t be surprised…”? Jeez.
Anyway. Zumaya just hit the 15 day DL. Francis Beltran up. Why not Cruceta? No options left?
“Are all of my posts started with “I wouldn’t be surprised…”? Jeez.'”
Ha. Yeah, you are rather fond of the phrase, I guess. Wouldn’t be surprised if you used it again.
Beltran? Huh? Well, I’ve lost track of Beltran. I’m sure it makes sense. No sense in rushing Cruceta back again for this season, no matter how well he’s doing with the Nud Hens.
Hey, Nud Hens! I like that. Some typos are too good to correct.
in about three weeks there won’t be any Nud Hens left they will be called the Detroit Nudgers
You’re right to gripe. 130 pitches in that situation is a stupid risk to take. The potential costs vastly exceeding the benefits of keeping him in there that long. Hopefully it doesn’t matter, but there is no reason to take chances like that, under the circumstances.
“in about three weeks there won’t be any Nud Hens left they will be called the Detroit Nudgers’
Right you are, and I’m looking forward to it. September is a fun month, whether you’re in the race or not.
All the statistics and such are interesting, but for me it’s much simpler: The outing after his 130-pitch marathon, Verlander looked like crap. He looked like wet toast. And that was exactly what I expected, and awaited that start with trepidation.
Now, it could be chance that he pitched so poorly after throwing all day, but I doubt it. Throwing 130 hard pitches fatigues an arm — heck, throwing 100 fatigues an arm. THAT’S WHY THEY REST FOR 4 DAYS.
I think the fact is, unless you’re a soft-tossing knuckleballer, 130 pitches is just too many, unless you’re in the post-season.