Prior to Justin Verlander’s last start we discussed his dip in velocity and a change in arm angle is he was looking to make. Verlander had some improved results in his Tuesday night start against the Rangers. Looking at his pitch f/x data he averaged 93.9mph with his fastball and peaked around 97mph. A definite improvement to be sure.
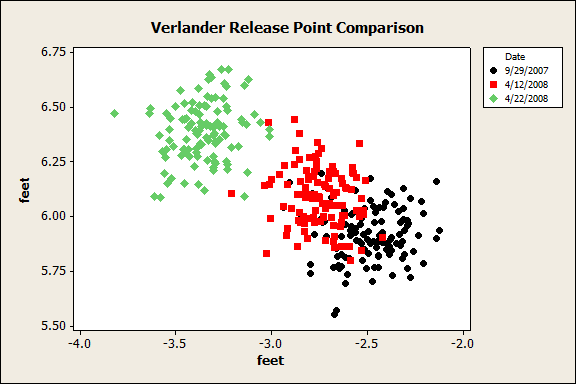
As for the arm angle, I added his Tuesday night release point data to the previous graph. Now there may be some calibration issues because the latest data was from Comerica Park and the other data was from Chicago. But there appears to be a marked difference, and maybe even an over adjustment.
Comments
5 responses to “Verlander arm angle follow-up”
Billfer, i feel like an idiot for asking, and perhaps you can just send me a link, but i have no idea what this graph means. Clearly, there’s an anomaly between 9/27/2007 and this year, but what does it mean. is this measuring the arm angle in terms of JV’s body, or the ground, or what? Sorry to ask questions that probably are obvious to most of your subscribers here, but it looks like you’re on to something, and I’d like to understand what it is. Thanks in advance.
Tom, it’s a plot of where Verlander is releasing the ball. Or in other words, where he’s letting go of the ball. It’s looking from home plate to the pitcher’s mound (so I assume). The more positive the vertical axis, the higher he’s releasing the ball. The more negative the horizontal axis, the more towards third base he’s releasing the ball.
It would be interesting to see which of these points are balls and strikes. It would be even better, and more pain-staking for those collecting this data, to include all three spatial dimensions.
Tom –
No idiocy at all. The bigger explanation is in the post I linked to, but Brian P got it pretty much right. It’s actually a proxy for release point. The pitch f/x cameras pick up the ball 50 feet from the front of home plate. Because it’s always 50 feet (now it is, they experimented with 45 and 55 feet last year as well) we don’t really have the need for the 3rd dimension.
As for Brian’s request it is possible, but for what I was looking for I decided to go with simplicity in the chart.
I’d lean towards calibration issue. It doesn’t seem logical to me that his hand would be further from his body and higher up. My understanding is that this data is taken from a fixed point, so maybe he’s simply starting from a different point of the rubber. Another explanation could be a smaller stride, which would lead to a higher release point.
I would guess the thing to look for would be precision within each start and whether he is having problems repeating his delivery within the start. Pitchfx seems to still be somewhat of a work in progress.
[…] the mound it will be Justin Verlander and Jered Weaver. Verlander reclaimed some of his missing velocity his last time out after tweaking his arm angle. He also earned his first […]