There are a few items that didn’t fit into the other posts about the outfield park factors that I wanted to wrap up.
First I wanted to acknowledge some other work that was done. Chone calculated outfield park factors in the fall of 2006. I either missed this or completely forgot having seen it.
Also, Dan Fox continues to post about simple fielding runs and has now calculated the metric for the outfielders, which include outfield park factors. What I found surprising in Dan’s work is that using SFR Curtis Granderson ranks below average. It’s the first defensive metric I’ve seen that has him ranking poorly. Comerica’s outfield park factors that show fewer balls dropping in, adjusts his SFR downward because in some respects Comerica’s centerfield is a little easier to play.
A more detailed look at Comerica
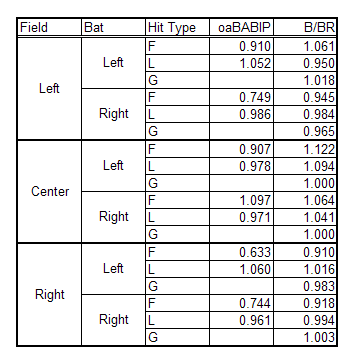
When I was doing the other park factors, I was doing it at a broader level. Fox was breaking it down by hit type and batter handedness. I had pulled back that data as well and thought it was worth looking at a more granular view. The table below reflects Comerica Park’s park factors for the last 4 seasons.

Lee commented in the original post that he was curious to see what would happen with line drives because Comerica Park has a reputation as being great for line drive gap hitters. This seems to hold true for lefties who see more balls than normal drop into the corner outfield spots. But for right handers the opposite is true.
Meanwhile right handed hitters are best served to drive the ball to centerfield which is the only field that is favorable for them.
I find it interesting that fly balls to center rank so well for righties while they rank poorly for lefties. I wonder if this is a case of positioning and that perhaps the fielders are over shifting. It’s also worth reiterating at this point though that we don’t really know where the balls are being hit using this data. We just know who ultimately fielded the ball.
It’s too complicated for me to understand all the data and even what a granular view is. Does this data only account for balls hit into the actual outfield. Wouldn’t having a good SS take some of those fly balls or hits from even reaching the LF’er versus the RF? Does the data take that into account, I guess that’s the question I’m asking.
Kathy –
This is only for balls fielded by outfielders. The infielders don’t really come into play except on pop-ups. I removed the grounders from the batting average on balls in play metric because outfielders can’t convert those to outs.
Basically I calculated a park factor for two metrics – batting average on balls in play and bases per baserunner. The first measures the rate that fly balls and line drives drop in for hits. The second is a measure of the impact of extra base hits.
To interpret the data, a value of 1 means Comerica Park is just like any other park. A value greater than 1, like say 1.06 means that Comerica Park is 6% more favorable than a typical park.
Gotcha. Thanks, Billfer.
Part of the reason I come to this blog is because of Billfer’s writing and analysis……something I could never do. Being challenged and able to say “I don’t get it” without fear of sounding stupid or made fun of.