I think everyone was mighty blown away by Joel Zumaya’s 2 inning save last night. He pounded the strike zone with 100mph plus heaters and buckled knees with his curve ball. But just for fun, and because we can, let’s take a look at all the pitches that made up his night.
I don’t know if you noticed in the playoffs last year, but MLB Gameday started using an enhanced version that had camera’s catching the path of the pitch, the velocity, and the release point. This was kind of a neat feature, but what makes it gold is that the data is captured and stored on MLB.com’s servers. Inspired by the book Baseball Hacks: Tips & Tools for Analyzing and Winning with Statistics, and with some programming of my own, I worked this offseason to be able to capture and analyze this data. Imagine my disappointment when after the first 8 games the Tigers hadn’t had an “enhanced” game. Fortunately they did last night.
I mentioned pounding the strike zone earlier, and the chart below is a plot of Zumaya’s pitches last night.
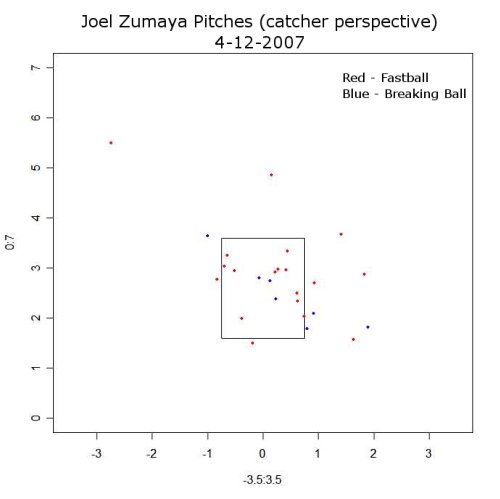
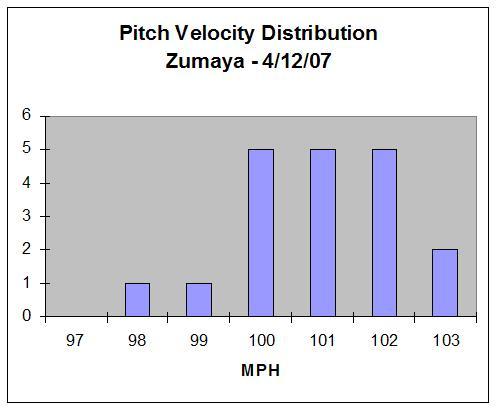
In 2 innings Zumaya only had a half dozen balls that weren’t in, or on the fringes of the strike zone. When he’s throwing those pitches in the triple digits, they all become close enough to induce swings. In fact, Zumaya’s average fastball was 100.3 MPH last night. The distribution of “speed balls” is in the chart below.
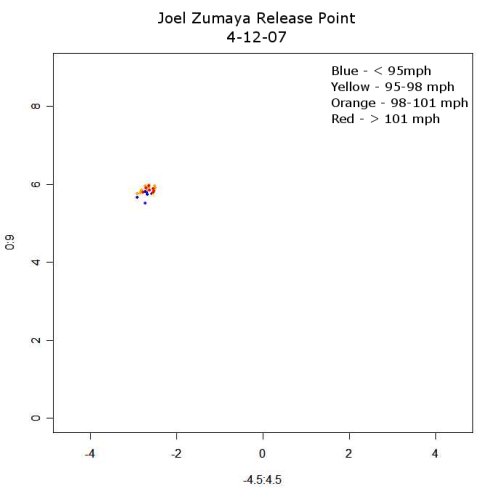
Now one of the things that we’ve heard about Zumaya are concerns about his mechanics. There are concerns about the violence with which he throws the ball, as well as inconsistencies in his delivery that can lead to wildness. Last night this wasn’t an issue, at least in terms of release point. The chart below is a plot of where Zumaya released the ball. It’s a nice tight cluster, and we also don’t see much variation as he reached back for more velocity either. His breaking ball seemed to be released slightly lower, but that was pretty consistent as well.
(This chart is from the catcher’s perspective. The units are in feet I believe. 0 on the x-axis would be the middle of the pitchers rubber)
Some final notes on the outing:
- Average fastball was 100.5 MPH and the median was 100.6
- He threw 7 off speed pitches and 20 fastballs.
- The offspeed stuff averaged 84.2MPH
- Fourteen of the fastballs were 100MPH+
- 7 pitches were balls, 8 were called strikes, 3 were swung on and missed, 4 were fouled off, and 5 were put in play
To see more of the cool stuff that can be done with this data, check out this post by Joe Sheehan at Baseball Analysts. He had some of the same thoughts, but has taken it a lot farther.
And as a final note: Vote for your favorite Tiger blog at Sports Illustrated si.com/tigersvote
Welcome to baseball analysis in the 21st Century!
Nice work Billfer!
I enjoyed the enhanced MLB gameday last night too (even with the photo of Stairs in a Tiger cap) but this is really taking it up a notch, Billfer. One thing I didn’t notice during the game is Zumaya’s pitch in the top graph that’s way up and left. Was that to a righty? Holy moly. Don’t dig in, batter. Another thing – has there been any talk of that video game he was playing or have we put that behind us?
Thanks for the analysis — confirms what TV showed last night that his mechanics and the end result of his pitches both seemed to be in control. I think he got away with a couple curves (blue dots above) that ended up too high but the difference in speed from the fastball and the movement on the curve will allow him to do it.
And wow, 100 posts on the game threads — I don’t think you need a vote on SI to know how popular the blog is (although I did go vote already).
Wow, this was an interesting read. Very, very good post.
Nice work! Do you have the same analysis for a less effective pitcher? It would be interesting to see the release point spread of, say, Jason Grilli. Zumaya’s release point variation looks tight, but you don’t really know until you compare to other pitchers.
Also, seeing the 7 breaking balls in 20 pitches makes me wish he’d utilize his changeup more then he does. He was voted by Baseball America as having the best change in the entire organization back in 2005 i think it was. And with Verlander’s change being highly touted around the same time they were in the minors together, that’s impressive.
So this is the stuff you were working on this winter that you did not get to show us? This is awesome stuff. It will be great when some day all the games will be in this kind of format.
Lee
Bilfer, is this data available on the MLB site somewhere as a database, or did you hand-enter those things one at a time? Could be fun to play with…
I’ll echo Doug. That release point graph needs to be compared to other pitchers. Feet? Zoom out to yards and even Hideo Nomo’s release point would be a single dot. Release point is a game of inches, so that graph can’t be considered conclusive.
I love the accuracy and off-speed stuff though! 🙂
Doug and Jeff – As I said, this is the first Tigers game with enhanced game day so I only have data for those who pitched last night. There will be more analyses like this coming through out the season, so hopefully will all learn something along the way.
Charlie – all the data is available in XML files on MLB’s site. To build the database you need to spider the data and then parse the xml.
Mike R – May have been a mis-nomer on my part in terms of the non-fastballs. I lumped everything that wasn’t a fastball into one category. The break is also measured, but I haven’t delved into that yet.
Lee – yep, this is the stuff.
Ben, the one way out of the strike zone was to Gregg Zaun.
Zumaya’s changeup is around 88-90 mph, and no speeds are in that range his fastest curve was 85 mph.
However can you send me a link to that particular xml file? You got two readings of 103 mph, but there didn’t appear to be any at 103 mph on the gameday.
Also can you send me the xml file from 10/10/2006, when Zumaya pitched against the Athletics in the ALCS?
Thanks man.
Awesome stuff. Reminds you of how special this kid is.