Last year Dave Studemund of the Hardball Times had a couple interesting posts taking a closer look at how many runs a team scores a game. This isn’t looking at average runs a game, but how many runs they score (and conversely allow) in each game. What Studes found is that consistency in scoring 2-6 runs is most important. At the time of the study, the White Sox average runs per game were a half run below average, but they very rarely were held to less than 2 runs. I found the study interesting enough to perform last year for the Tigers, and I’ll repeat it this year.
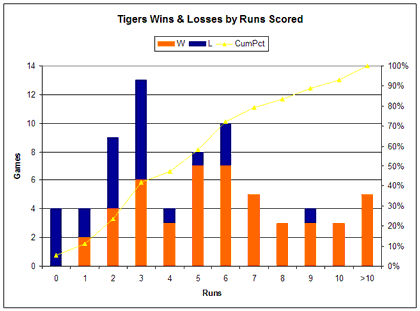
The first graph is the Tigers distribution of runs scored. The total height of each bar is indicative of the number of games, and the different colors show how often the team won. The yellow line and the right axis shows the cumulative percentage of games played (ie Tigers score 3 runs or fewer ~40% of the time).

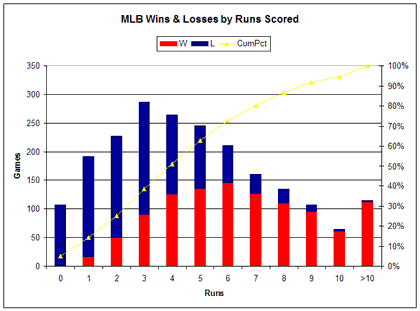
The following is what the league on whole did in terms of runs scored.

Like many of the Tigers offensive numbers, they are are somewhat in line with a typical team on the whole. Where they differ is in their frequency of scoring 4 runs. The Tigers have scored 3 runs and 6 runs a little more frequently than the rest of the league. What you’ll also notice is that the Tigers have performed better than the rest of the league in those low scoring games. At 3 runs teams typically win 31% of those games while the Tigers are at 46%. In fact, the Tigers have outperformed the league average winning percentage at every run level.
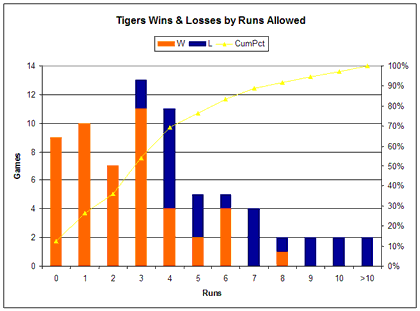
So how do the Tigers manage to outperform the rest of the league at every run level? It’s the pitching of course. Below we see the Tigers distribution of runs allowed.

The Tigers pitchers and defense hold teams to 3 runs or fewer in 54% of their games. Talk about giving your team a chance to win. But it’s not just that the Tigers run prevention is good, it’s that they seem to be very proficient at getting just enough in those games. In fact, Detroit is 37-2 when holding opponents to 3 runs or less. The rest of the league would only have won 31.
This provides a nice segue into expected wins. If we look at the league winning percentage at a given run level and compare it to the number of games a team scores at each run level, we can find the expected wins. Of course we could always do this in aggregate with the pythagorean formula of runs scored and runs allowed, but this gives allows for a deeper dive.
Based on runs scored the Tigers expected wins through Wednesday would be 36. So based on offensive output, the Tigers record would be approximately .500. But working with runs allowed the team’s expected wins are 43 This is another indication of how much run prevention has been the story for the 2006 Tigers.
But that 43 wins is till 5 off of the Tigers current pace. So there has been an element of good fortune in the timing of the way the Tigers have scored runs. Because their overall pythagorean record is right in line with the actual record, I don’t think the Tigers have been extroadinarily lucky, but they have been the beneficiaries of some good luck.
I still think the offense can be better than what we’ve seen. And while the Tigers ability to limit scoring might not be able to keep up it’s current outstanding pace, hopefully the offense can pick them up.
If you’d like to play around with the numbers for yourself, I’ll make my spreadsheet available. The source data was obtained from Baseball Prospectus.
*cough*Wilson*cough*Santana*cough* 🙂
So the bottom line seems to be what we’ve been trying to tell ESPN all year: We’re not quite “Best in Baseball” good, but we’re legitimate contenders.
Good stuff. I wonder whether there’s any factor we can point to to account for the low number of four-run games–or if it’s just a quirk in a relatively small sample. Nothing occurs to me off the top of my head.
http://www.baseballprospectus.com/statistics/standings.php
(shouldn’t require subscription)
That alone tells me the Tigers are legitimate, plus the way they play the game gives the impression.
Detroit also has the second most expected wins and winning % in the Baseball Prospectus third-order adjusted standings, behind the Yankees. Those are based on equivalent runs and strengths of schedule. Again, they have a few more wins than expected.
Good work, Bilfer!
If I had to guess, I’d say the 4-run thing is a statistical quirk.