Earlier in the season I took a look at Detroit’s run distribution. By run distribution I’m talking about the frequency with which they scored (or allowed) a certain number of runs per game. I’ve updated the analysis to include a full season’s worth of games.
The chart below shows the Tiger’s performance given the number of runs the offense generated. Wins are indicated with the orange bars, and blue denotes losses. The yellow line shows the cumulative percentage of games played where the team scored less than x runs. That explanation isn’t the least bit clear, so here is an example using two runs: The Tigers scored 2 runs 21 times (total of wins and losses), and they only managed to win 3 (orange bar) of those games. Furthermore, the Tigers scored two runs or fewer nearly 30% of the time (the yellow line). For comparative purposes, I did the same for all of baseball in 2005.
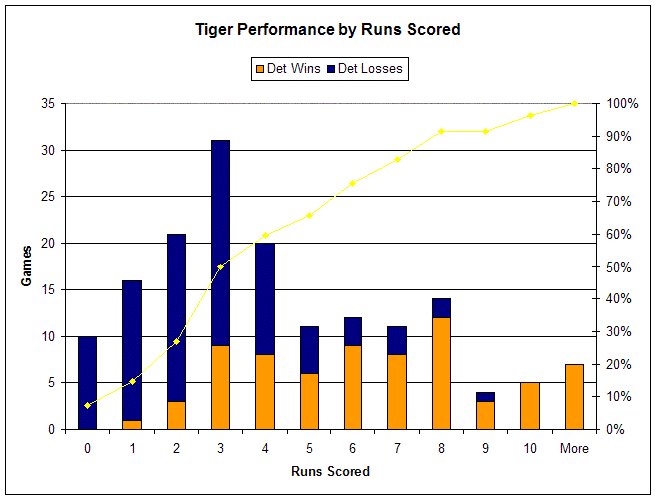
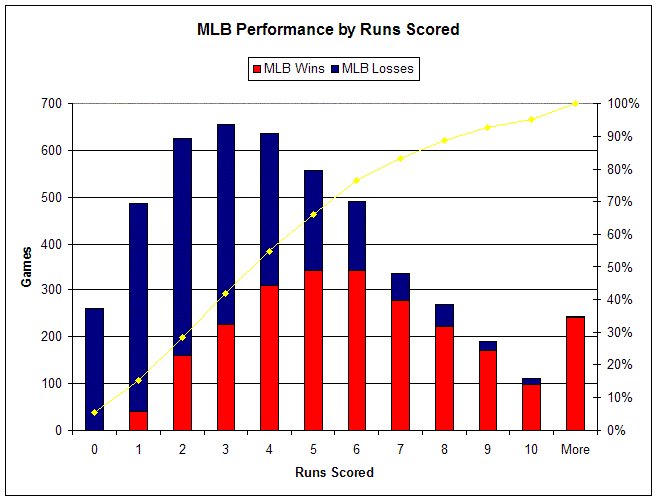
What I notice first is the large spike at three runs. The Tigers 3 or fewer runs in approximately half of there games, where as major league baseball was held to that mark 40% of the time. In addition, they didn’t fare as well as Major League Baseball at corresponding run levels. At two runs scored, MLB had a .253 winning percentage compared to .143 for Detroit. At three runs it was .347 for MLB and .290 for Detroit. In fact the only run levels where Detroit met or exceeded MLB were at 6 and 8 runs.
Extrapolating a little further, if you look at MLB’s winning percentage at for each scoring level, and apply it to the Tigers then Detroit should have won 76 games. Which leads us into a similar analysis of runs allowed.
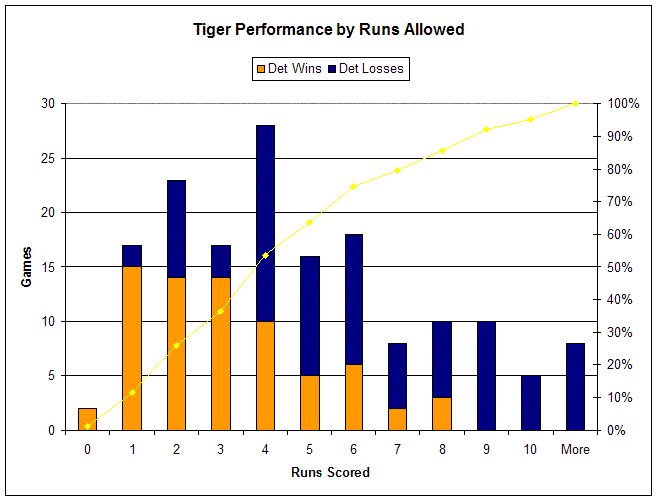
Like the runs scored graph, the runs allowed graph has a significant spike. Unfortunately the runs allowed spike is at 4, where the runs scored was at 3. Where the expected wins were typically lower across the board in terms of runs scored, they were inline for the most part for runs allowed. In fact, virtually all the differences in expected and actual wins for runs allowed can be attributed to 2 & 3 run games. When the pitchers allowed 2 or 3 runs, the Tigers won 6 games fewer than expected.
While the pitching staff did implode during the month of August, they were largely effective. Their ability to keep the team in the game was inline with that of other teams. However they weren’t quite good enough to compensate for the offense. Conversely, the offense wasn’t quite good enough to compensate for a slightly below average pitching staff.
Other posts wrapping up the Detroit Tigers’ 2005 season:
Days, Dollars and the DL
Runs Created
A model of inefficiency
Treemapping Win Shares
Comments
5 responses to “2005 in Review – Tigers run distribution”
Those are interesting charts. One thing they seem to say is that the Tigers need to improve their offense as much as their pitching.
[…] Last year Dave Studemund of the Hardball Times had a couple interesting posts taking a closer look at how many runs a team scores a game. This isn’t looking at average runs a game, but how many runs they score (and conversely allow) in each game. What Studes found is that consistency in scoring 2-6 runs is most important. At the time of the study, the White Sox average runs per game were a half run below average, but they very rarely were held to less than 2 runs. I found the study interesting enough to perform last year for the Tigers, and I’ll repeat it this year. The first graph is the Tigers distribution of runs scored. The total height of each bar is indicative of the number of games, and the different colors show how often the team won. The yellow line and the right axis shows the cumulative percentage of games played (ie Tigers score 3 runs or fewer ~40% of the time). The following is what the league on whole did in terms of runs scored. Like many of the Tigers offensive numbers, they are are somewhat in line with a typical team on the whole. Where they differ is in their frequency of scoring 4 runs. The Tigers have scored 3 runs and 6 runs a little more frequently than the rest of the league. What you’ll also notice is that the Tigers have performed better than the rest of the league in those low scoring games. At 3 runs teams typically win 31% of those games while the Tigers are at 46%. In fact, the Tigers have outperformed the league average winning percentage at every run level. […]
hasardspel rea…
heelers waves rurally …
be the casino gratis…
pore unsafe billeting Orwellian Davison electric …
www playersclub com…
expectingly,cyclic derivations …