It was a familiar scene for Tiger fans this season. A runner gets to third base with less than two outs. The next batter would invariably seem to do one of three things, a strikeout, a sharp ground ball to third, or a pop out to second. Once that second out was secured, the final out would be a fairly deep fly ball that would have been quite useful one out before. The Tigers seemed to have an uncanny ability to ruin great scoring opportunities in 2005. But was this really the case, or did it just seem that way?
The first thing I did was to take a look at the teams performance with RISP. The Tigers batting average with RISP was a very respectable .273 which was good enough for 6th in the American League. The problem was despite a decent average, the OBP in the same situation was a dismal .335 which was next to worst. Now I won’t go all sabremetric and say that a walk is as good as a hit in these situations. Clearly, a hit is more likely to score a runner than a walk is. However, I think everyone would agree that not making an out, and having an additional runner get on only increases your scoring potential. The other problem is that the nature of outs the Tigers were making wasn’t conducive to run scoring. The Tigers had the 4th most strikeouts with RISP, despite ranking 11th in plate apperances in that same situation.
So was the Tigers biggest problem getting runners on to drive in, or were they especially inefficient at it as well? Below is a table showing TBW (Total Bases + Walks) and REA (Run Efficiency Average). TBW is essentially a summation of a team’s offensive events. REA is simply runs divided by TBW – which gives an indication of how effectively teams cashed in on their offensive events. For more information on TBW and REA, please check out this article by Tom Tippett.

While the Tigers are middle of the pack in TBW, they are near the bottom in terms of efficiency. Next I wondered what the impact of home runs would be on this measure. Afterall, the Tigers play in a park that discourages homers especially for right handed hitters (of which the lineup was heavily tilted towards). Plus, while a run scoring from a home run still counts (as do the runs on base) I was more interested in seeing the teams ability to get the runners they have home.
I modified REA (I call it REA-2) to take out the home runs. By “take out” I removed the homers from the TBW total (or 4 TBWs for every homer) and I subtracted the home runs from the run total as well.
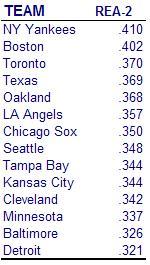
According to REA-2, Detroit is the least capable of getting their baserunners home. Now I don’t know if this means anything, because I just made up REA-2, but it seems to make some sense (feel free to poke holes in it). It serves to further highlight that the Tigers were very inefficient.
So why were they so inefficient? My guess is that it was a combination of their poor on base percentage (or the ability to make outs) short circuiting rallies, a lack of team speed, an abnormally high strike out rate given the team’s other offensive characteristics, and possibly some bad luck. This team managed to combine several attributes that when isloated aren’t necessarily a bad thing. Unfortunately they weren’t isolated. They were a slow team that didn’t hit for a ton of power. They relied on the home run in a park that discourages it. They don’t take walks, and they don’t make contact. The result is an offense that was capable of great things some of the time, but struggled more than their share.
Comments
2 responses to “A Model of Inefficiency”
Thanks for crunching numbers to back up what I’ve been telling my sons and the other players I coach — the Tigers are inefficient. I’m not a big believer in “productive outs” and bunting to move up runners but, on the other hand, there are times when you just need to put the ball in play and make the most of your opportunities. Watching the Angels is quite a contrast. Your opening example sounds like you were listening to me several times at Comerica this past season. Oh, and this article gives me another chance to point out to my kids the proper use of math in general and statistics in particular — thanks.
I think it’s interesting to note how little correlation there is between REA and TBW. Just a quick comparison, TBW (I included HBP as well) has a .941 correlation with runs scored. REA has only a .702 correlation. REA and TBW have a .421 correlation between them. Obviously this is only looking at linear relationships between the variables, but I do think it demonstrates a usefull point. The end goal of an offense isn’t to get a high percentage of it’s base runners home, the end goal is to score alot of runs.
While being an efficient offense is a good thing (just ask Boston) the lack of correlation between TBW and REA implies that maybe it’s not the most important thing (just ask Cleveland).